economy
November 2, 2026
Eyes on the Economy: Consumer Confidence, Housing, Rates

Consumer Confidence Improves but Remains on Long-Term Downward Trend
The Conference Board’s October 2026 Consumer Confidence Index rose 7.5 points to 91.7, its highest level since June, as consumers viewed current business and labor conditions more favorably and became less pessimistic about the next six months. The subindex for present situation climbed 8.6 points to 120.4, while the subindex for expectations rose 6.9 points to 72.6. Despite the rebound, expectations remained below the level that can signal recession risk, and confidence remained on a longer-term downward trend.
Consumers continued to report frustration with high prices, especially for food and fuel. Their average inflation expectation for the next year eased but remained elevated at 5.8%. Plans for purchases of durable goods and services generally weakened, as did vacation plans. Confidence gains were uneven: Younger consumers and households earning at least $100,000 were more optimistic on a six-month average, while older generations remained less confident. Overall, the October improvement suggests some relief, but persistent cost pressures are still weighing on spending intentions.
Homebuilder Sentiment at 14-Year Low
The National Association of Home Builders (NAHB) Housing Market Index (HMI) fell three points to 29 in October, its lowest reading since June 2012, as rising mortgage rates and construction costs weakened the outlook for new homes. Mortgage rates climbed above 7%, while higher energy and material prices, more expensive construction loans and worsening labor and land availability added pressure. Builders also reported that immigration enforcement was causing delays and discouraging some workers from showing up. Although demand remains, affordability challenges, higher borrowing costs and weaker consumer confidence are keeping buyers on the sidelines. The buyer-traffic index dropped to 18, its lowest level since April 2012, excluding the pandemic’s onset. All three HMI measures declined: Current sales conditions fell to 33, expected sales over the next six months to 32 and prospective buyer traffic to 18. To attract buyers, 43% of builders cut prices, averaging 6%, while 65% offered sales incentives. Regional sentiment declined across the Northeast, Midwest, South and West.
Fed Votes to Keep Rates Steady with Two Dissents
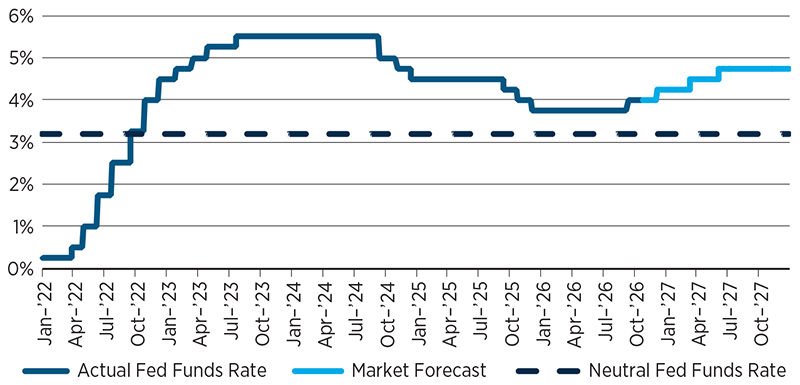
The Federal Reserve held its federal funds target rate at 4% after raising it in September, opting to wait for more data before deciding whether another increase is needed. The 10–2 vote included dissents from Fed Governor Lisa Cook and Cleveland Fed President Beth Hammack, who favored a quarter-point hike. The Fed’s statement left the door open to further tightening, and markets continued to anticipate a possible December increase.
Fed Chairman Kevin Warsh said inflation expectations had eased despite persistently high energy prices, suggesting the Fed’s actions were having an effect. He also argued that higher rates can influence the artificial intelligence (AI) investment boom, even if its biggest companies have ample cash. The challenge is that inflation pressures are coming from energy costs, tariffs and heavy spending on data centers, semiconductors and electricity, while the labor market shows little sign of overheating. Officials disagree over whether rates are already restrictive enough or whether more increases are needed to keep prolonged above-target inflation from becoming entrenched. The decision offers little immediate relief to borrowers: Credit card and auto loan costs remain sensitive to Fed policy, while rising Treasury yields have pushed up mortgage rates and financing costs for some AI-related companies.
Markets Expect a Rate Hike in December
Source: FedWatch Tool.
Recent Economic Releases
| Indicator | Prior period | Current period (forecast) | Current period (actual) |
|---|---|---|---|
| The Conference Board Consumer Confidence (Oct.) | 84.2 | 81.0 | 91.7 |
| NAHB Housing Market Index (Oct.) | 32 | 32 | 29 |
| Federal Funds Rate | 4.00% | 4.00% | 4.00% |
| 30-Year Fixed Mortgage Rate (Oct. 23) | 7.41% | N/A | 7.37% |
Key Interest Rates
| 10/26/26 | 10/19/26 | Change | |
|---|---|---|---|
| Fed Funds | 4.00% | 4.00% | --- |
| 2-yr. UST | 4.71% | 4.76% | (0.05) |
| 5-yr. UST | 4.82% | 4.93% | (0.11) |
| 10-yr. UST | 4.99% | 5.14% | (0.15) |
| 30-yr. UST | 5.30% | 5.47% | (0.17) |
Rate Forecast — Futures Market
| 4Q26 | 1Q27 | 2Q27 | 3Q27 | |
|---|---|---|---|---|
| 4.25% | 4.50% | 4.75% | 4.75% | |
| 4.60% | 4.54% | 4.44% | 4.32% | |
| 4.75% | 4.68% | 4.59% | 4.48% | |
| 4.97% | 4.90% | 4.82% | 4.76% | |
| 5.37% | 5.31% | 5.24% | 5.17% |