cfc-news
November 16, 2020
KRTA Expert Shares Four KRTA Toolpak Tips

With the recent release of the 2019 Key Ratio Trend Analysis (KRTA), CFC’s KRTA expert shares four tips on how members can use the KRTA Toolpak to get the most out of the statistical, financial and operational performance of 816 electric distribution cooperatives.
“I’m excited to share these KRTA Toolpak tips that will enable members to analyze their cooperative performance and create graphical PowerPoint presentations in minutes, not hours,” CFC Senior Manager of Financial Products and Analysis Bettina Kimmel said. “Before you dive into reviewing all 145 ratios, you should already have an idea of your cooperative’s performance. What you might not know is how your cooperative benchmarks within the nation, your state, size, generation and transmission cooperative, and plant growth. This is where the fun begins and CFC built several ways for you to analyze your performance when compared with others.”
Tip 1
Using “Co-op % Changes” Worksheet

Find your cooperative’s most significant changes. Analyze your cooperative decisions, events and ratios’ impact overtime. Using the “Co-op % Changes” Excel worksheet, the ratios with the largest change will be prominent in the chart. In this case, “Ratio 141 System Average Interruption Duration Index (SAIDI) – Extreme Storm, measured in minutes” stands out for this cooperative, and 2019 shows the system suffered several major weather events that created a large shift in outage minutes from the previous year.
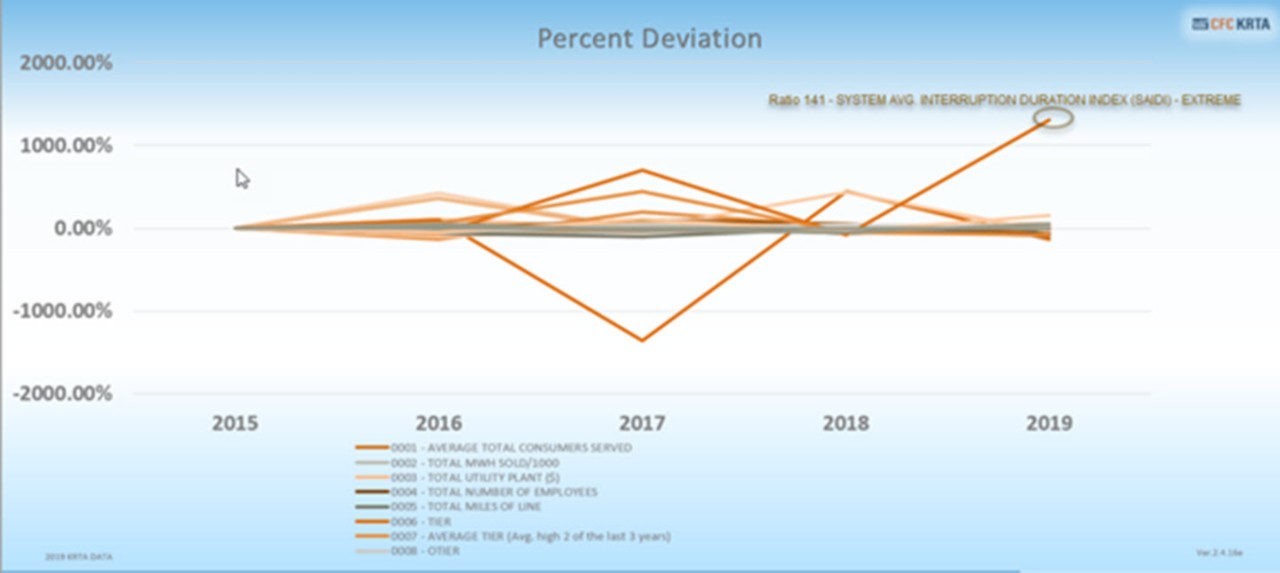
Another feature of this worksheet is the ability to select the top five ratios with the largest change from the previous year. The ranking identifies the most significant changes among all ratios and the 10 ratio categories. This is helpful when analyzing cooperative decisions and performance over the years.
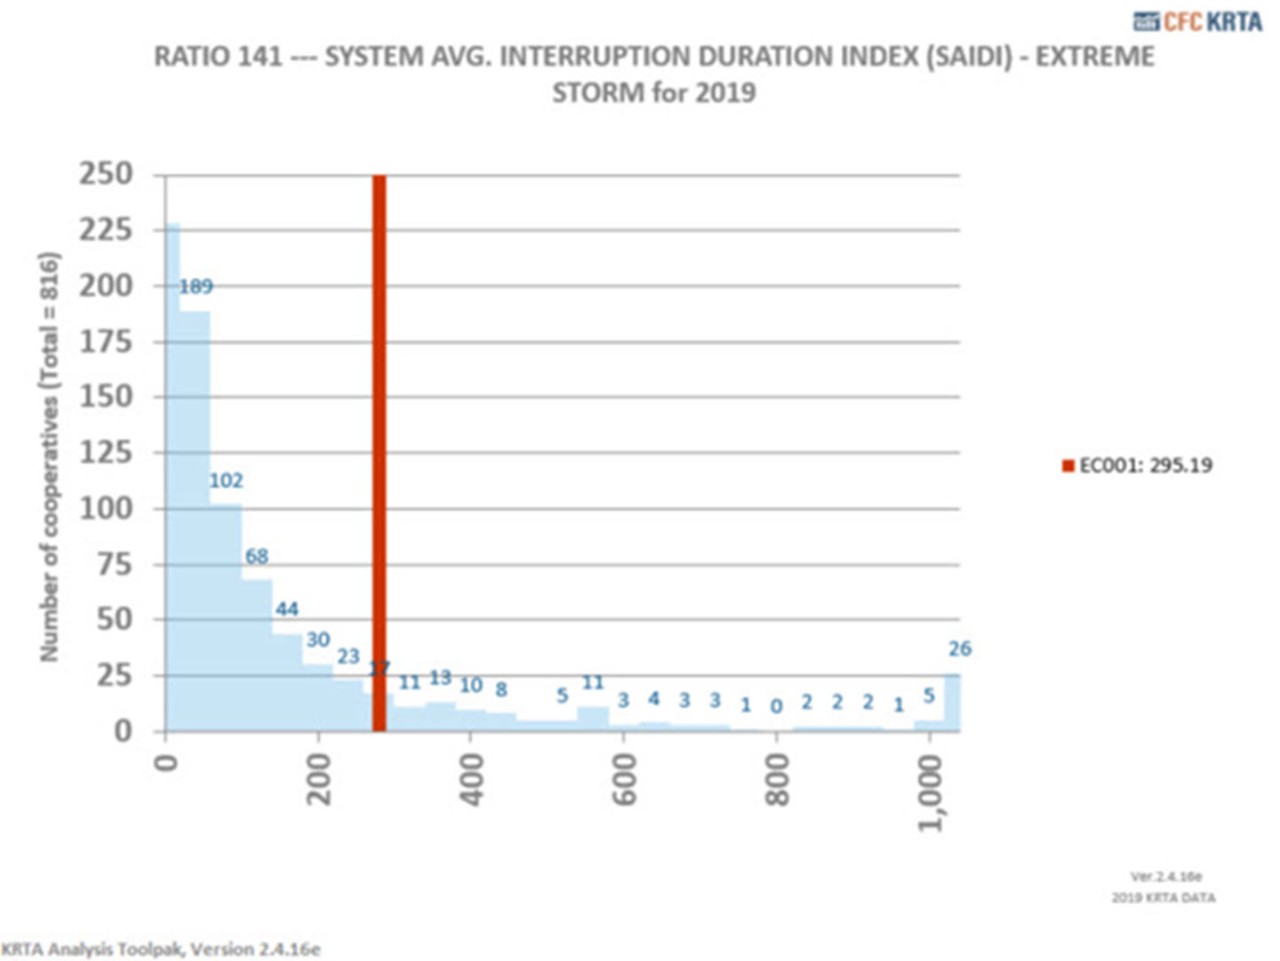
Tip 2
Using the “Histogram” Worksheet

In this tip, we use the same co-op and ratio to demonstrate how a histogram can be helpful to determine how your cooperative compares with the nation. The nation is depicted by the light blue bars (buckets) that for 2019 include 816 participating cooperatives. This is helpful to identify if your cooperative was unique or if other systems had the same experience (i.e., in this case, extreme weather events). At a glance, the sample cooperative represented by the red line in this tip immediately draws attention. It appears that most cooperatives experienced fewer minutes of interruption caused by extreme weather. The histogram does include additional statistical references (quartiles) or KRTA peer group data that can be used together or separately to explain your cooperative’s position in 2019. The histogram may prompt dialog among cooperative staff of shared experiences of similar events.
Tip 3
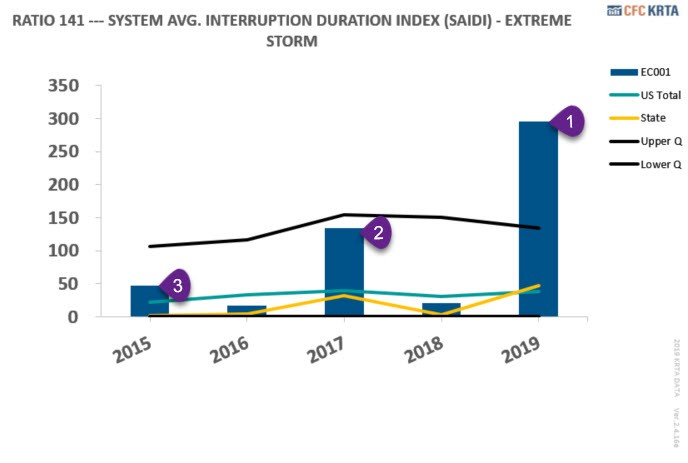
Using the “KRTA Chart” Worksheet

Using the “KRTA Chart” worksheet, you can immediately review the five-year trend. Using the same sample cooperative from the other tips: (1) 2019 stands out followed by (2) 2017 and (3) 2015. Notice how the cooperative compares with the upper and lower quartiles (black lines), U.S. (green line) and state (yellow line) over the five-year period. The lines help graphically represent how, for 2019, the cooperative was above the upper quartile. This ratio illustrates the cooperative suffered one or more very impactful weather events.
Remember, sometimes we focus on one ratio to the detriment of the bigger picture. Sometimes, a cooperative’s performance may be better seen from different angles and by combining other ratios in an analysis. Using the example below, we could also review Ratio 2 “Total kWh sold” to evaluate the weather impact on kWh sales.
Tip 4
Creating Your KRTA Presentation

This tip could save you a lot time. Using either of the two presentation exporting methods—current or multiple—will enable you to build PowerPoint presentations for board or senior management discussions. We recommend using the “Export Multiple Selected Ratios to PPT” option when working with more than five ratios. This is a time-saver and includes an additional feature to select the location of the chart in a new or existing PowerPoint presentation deck.
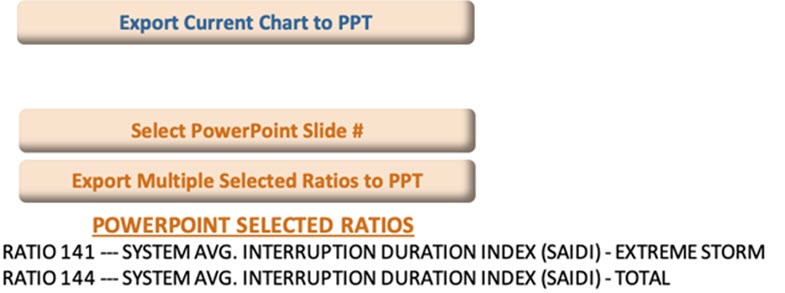
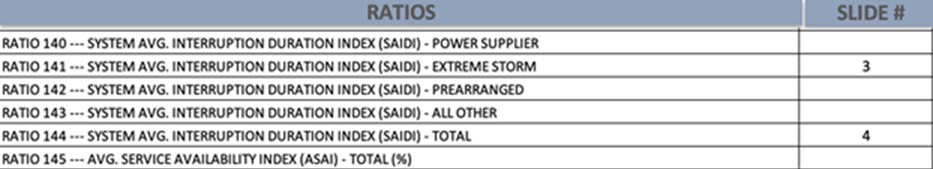
For slide location, go to the “Select PowerPoint Slide #” worksheet and enter the slide number where the ratios should be placed into the presentation.

“I hope these four KRTA Toolpak tips assist you in analyzing and communicating your cooperative’s performance to your board and senior management,” Kimmel said. For questions regarding the model or interpreting KRTA results, e-mail krta@nrucfc.coop.