Eyes on the Economy: Home Prices, Inflation, Job Openings

Home Prices Edge Down from Record High
The Federal Housing Finance Agency House Price Index for average single-family houses with mortgages guaranteed by Fannie Mae and Freddie Mac fell 0.1% in January from December’s record high. This marked the first decline since August 2022. With the marginal month-over-month decline, house prices were still 6.3% higher than a year ago.
In four of the nine census divisions (Mountain, East South Central, Middle Atlantic and South Atlantic), house prices were slightly lower in January than December. In three divisions (Pacific, West South Central and East North Central), house prices remained unchanged while West North Central and New England posted positive price growth. Overall, there is no relief in home prices. With mortgage rates decreasing in recent months, pent-up demand will likely put upward pressure on prices.
Fed Inflation Gauge Rises
The Personal Consumption Expenditure Index (PCE), the Federal Reserve’s preferred inflation gauge, ticked up from 2.4% in January to 2.5% in February as expected. When excluding food and energy, the core inflation gauge edged down from 2.9% to 2.8%. On a month-over-month basis, PCE increased 0.3% in February, slightly less than January’s reading of 0.4% while core PCE also increased 0.3%. The increase was driven by both goods and services. Furthermore, energy prices posted a month-over-month increase of 2.3%.
Meanwhile, consumer spending accelerated to a month-over-month rate of 0.8%, the largest gain since January 2023. Consistent with what was seen in PCE, spending was driven by both goods and services. Although spending accelerated, personal income growth decelerated to 0.3% in February from the one-year high of 1% in January. Overall, the data have not seen a trend showing sustainable disinflation and slowing in consumer spending to support rate cuts yet. Markets have become increasingly uncertain about a rate cut in June.
Number of Job Openings Edges Up in February
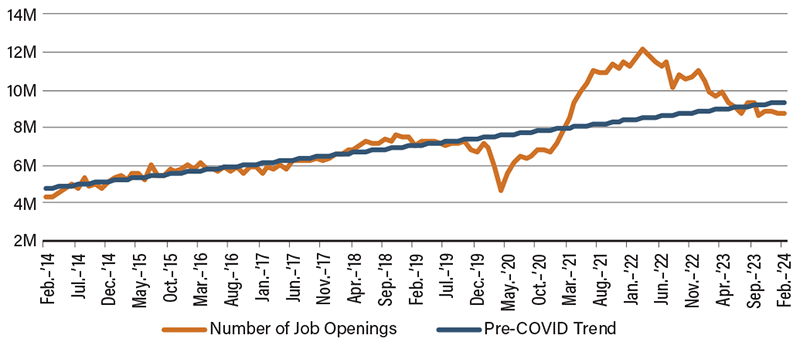
In February, the number of job openings edged up to 8.76 million from January’s 8.75 million. Although the number of job openings has overall been on a downward trend since its peak in March 2022, the latest figure is still higher than the pre-COVID February 2020 figure of 7.45 million. However, it is important to note that reading raw figures without accounting for population growth is misleading. As the size of the economy and the population increase, the number of job openings should increase as well. However, despite being higher than pre-COVID numbers, February’s reading is consistent with the pre-pandemic growth trend, which has been the case since mid-2023. Contrary to what many have claimed, the labor market recently has been “normal” instead of hotter than usual and might even have begun to run below the pre-COVID trend.
Similarly, the rate of job quits remained at 2.2%, more or less the same as the levels seen in the three-year period prior to the pandemic and much lower than its peak of 3% in 2022. The quits rate has not changed since November 2023. Overall, the data suggest workers’ confidence in securing new jobs is back to what it used to be before the pandemic—once again, indicating that the labor market is back to normal in terms of demand and job security, although supply may be tighter than pre-COVID.
Job Openings Are Consistent with Pre-COVID Trend

Source: U.S. Bureau of Labor Statistics.
Notes: Pre-COVID trend line is calculated based on Feb. 2014 to Feb. 2020 numbers.
Recent Economic Releases
| Indicator | Prior period | Current period (forecast) | Current period (actual) |
|---|---|---|---|
| House Price Index (Jan.)(MoM) | 0.1% | 0.1% | (0.1%) |
| Personal Consumption Expenditure (Feb.)(YoY) | 2.4% | 2.5% | 2.5% |
| Core Personal Consumption Expenditure (Feb.)(YoY) | 2.9% | 2.8% | 2.8% |
| JOLTs Job Openings (Feb.) | 8.75M | 8.75M | 8.76M |
