Eyes on the Economy: Compensation, GDP, Home Prices

Compensation Costs Rise
Compensation costs for workers increased 1.2% in the first quarter of 2024—compared with an increase of 0.9% in the final quarter of 2023. The private sector saw a rise of 1.1% while state and local governments posted an increase of 1.3% in compensation costs. On a year-over-year basis, compensation costs grew 4.2%. Unionized industries posted a higher compensation cost growth rate of 5.3%—compared with 3.9% in nonunionized industries. The increase in compensation costs fuels concerns about further inflationary pressures on consumer prices as employers may pass on their wage costs to consumers.
The rise in compensation costs may appear to be good news for workers. However, inflation-adjusted compensation for workers in the private sector only increased 0.6% year-over-year. Contrary to the positive reports on the labor market, workers are far from winning in the current scenario.
Real GDP Growth Slows
U.S. real gross domestic product (GDP) grew 1.6% in the first quarter of 2024, much lower than the previous quarter’s growth of 3.4% and consensus forecasts of 2.5%. Consumption, the main engine of U.S. GDP, contributed only 1.68 percentage points to real GDP growth—compared with a contribution of 2.2 percentage points in the final quarter of 2023. Meanwhile, net exports subtracted 0.86 percentage point from growth as a result of the increased trade deficit.
The quarterly Personal Consumption Expenditures (PCE) Price Index increased 3.4% in the first quarter, up from 1.8% in the final quarter of 2023 and well above consensus forecasts of 2.9%. With inflation showing early signs of plateauing above the target rate or even reaccelerating, the much-celebrated soft landing—a scenario in which interest rates rise just enough to curb inflation without triggering a recession—now appears more like an illusion, though it’s still too far away to see clearly.
U.S. Home Prices Climb to a Near All-Time High
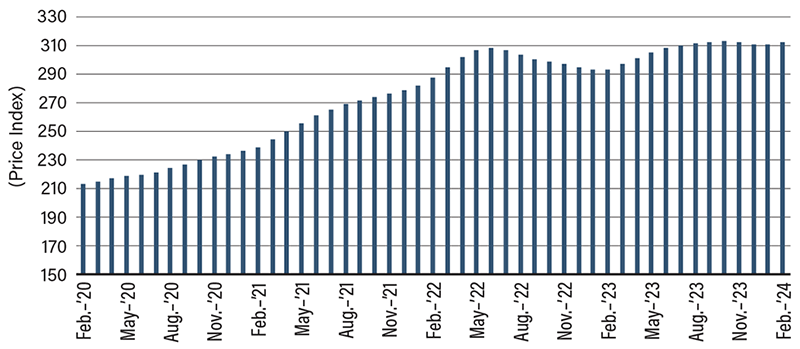
If you need evidence of the lack of impact of rate hikes on prices, look no further than the housing market. The S&P CoreLogic Case-Shiller National Home Price Index increased 6.4% year-over-year in February 2024 to a level that is less than a point below the record high posted in October 2023. Despite higher mortgage rates, supply-demand imbalances continue to keep home prices significantly higher than pre-COVID levels—roughly 46.4% higher than February 2022. Home price data typically lag behind interest rate data, so what we see here is market enthusiasm in February this year, when the consensus was that the Federal Reserve would soon cut interest rates. That consensus has since faded. Will the current high-for-longer rate outlook bring about much-needed declines in home prices? Unlikely.
Throughout the current tightening cycle, home prices have remained at least 37% higher than pre-COVID levels. We saw some marginal declines that didn’t last long. In the near term, we may see some small decreases, but as soon as expectations for lower interest rates return, home prices will jump again. This is because the current housing market is much more influenced by factors that increase prices than by factors that should drive down prices.
Home Prices Soar After COVID Strikes

Source: S&P Global.
Recent Economic Releases
| Indicator | Prior period | Current period (forecast) | Current period (actual) |
|---|---|---|---|
| Employment Cost Index (Q1 24)(QoQ) | 0.9% | 1.0% | 1.2% |
| Real GDP Growth (Q1 24)(QoQ) | 3.4% | 2.5% | 1.6% |
| PCE Prices (Q1 24)(QoQ) | 1.55M | 1.48M | 1.32M |
| S&P Corelogic Case-Shiller Home Price Index (Feb. 24)(YoY) | 3.2% | 3.4% | 3.5% |
