Eyes on the Economy: Retail Sales, Home Prices, Inflation

Retail Sales Beat Forecasts
Retail sales in March increased 0.7% month-over-month, beating the forecast figure of 0.3% and following an upwardly revised February figure of 0.9%. The gains were led by nonstore retailers and gas stations, which reflected the recent increases in gasoline prices. Meanwhile, there were declines in sporting goods, hobby and bookstores, clothing, and electronics and appliances. The sales values are expressed in dollar terms and therefore are impossible to provide an accurate look at whether or not the gains were driven by increases in quantity purchased or by inflation that pushed up sales values.
Overall, the increase in retail sales was consistent with data for consumer spending and inflation. Recent economic releases have consistently
Mixed Story for Home Builders Indicators
The National Association of Home Builders (NAHB) Housing Market Index held steady at 51, slightly above the neutral point, in April. Current sales conditions slightly improved from 56 to 57, reflecting partial return of demand as home buyers were expecting rate cuts this year. Although the index suggests that homebuilder overall sentiment has been out of the pessimistic territory for two consecutive months, it is a mixed story when considering other indicators.
Housing starts declined 14.7% in March to a seasonally adjusted annualized rate of 1.32 million units, well below forecasts of 1.48 million. As interest rates pushed higher than expected in March, financing new building projects was more expensive, while costs of building materials continued to be elevated. Low housing starts today means low new home supply within the next 12 months. That suggests, if demand increases 12 months from now when rates are lower, we may be looking at an even more imbalanced housing market, potentially putting more upward pressure on home prices.
Energy, Shelter Cause Inflation to Stop Decelerating
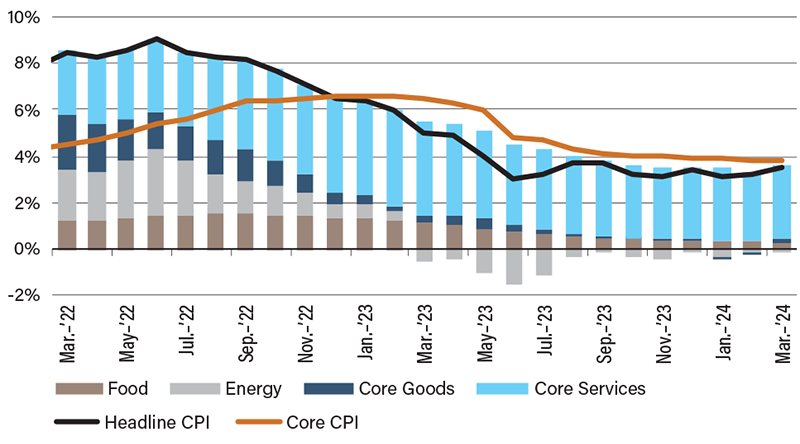
Year-over-year Consumer Price Index (CPI) accelerated for a second straight month to 3.5% in March, following an increase of 3.2% in February. The acceleration was largely driven by increases in energy prices. As we noted in our 2024 Economic and Industry Trends report, inflation risk for this year is tilted to the upside, with two factors driving potential resurgence: energy and shelter. Disinflation progress seen last year was largely driven by energy prices falling from its 2022 high levels. This price category is very prone to geopolitical tensions.
Additionally, shelter remained the largest contributor to overall inflation. Economists were forecasting some declines in rents. However, we note in our report that with high home prices, would-be homebuyers are priced out of the buying market and forced to stay in the rental market, keeping demand high and therefore rent high. Shelter inflation remained steady at 5.7% and continued to drive the overall inflation.
Similarly, the Producer Price Index, a measure of wholesale inflation, also accelerated for a second straight month. The overall picture is getting clearer: inflation has stopped decelerating and may even be on a path to resurging.
Energy, Shelter Drive Consumer Price Index Increase

Source: U.S. Bureau of Labor Statistics.
Recent Economic Releases
| Indicator | Prior period | Current period (forecast) | Current period (actual) |
|---|---|---|---|
| Retail Sales (Mar.)(MoM) | 0.9% | 0.3% | 0.7% |
| NAHB Housing Market Index (Apr.) | 51 | 51 | 51 |
| Housing Starts (Mar.) | 1.55M | 1.48M | 1.32M |
| Consumer Price Index | 3.2% | 3.4% | 3.5% |
