economy
November 15, 2021
Eyes on the Economy: Housing, Payrolls, GDP

Housing Cools Slightly
House-price appreciation cooled slightly in August, as measured by the S&P CoreLogic Case-Shiller 20-City Composite Index, snapping a 13-month-long streak of year-over-year price growth. The not seasonally adjusted index was up 19.7 percent from August 2020, down from the revised 20 percent year-over-year growth rate in July but still clocking near its fastest pace in two decades.
Despite the rapid rise in prices over the past 18 months, housing supply in relation to demand remains scarce. Existing-home listings are less than half their level a decade ago, though about 45 percent higher. Consequently, a larger number of homeowners are struggling with affordability, and the share of homes being sold to low- and middle-income homebuyers has declined. New-home construction activity is insufficient to relieve the supply-side pressure. It is also contending with rising land, labor and material expenses.
Expect supply-side challenges to persist into 2022, while demand drivers will steadily improve. Income and wage growth should remain healthy and provide potential homebuyers with additional ability to save for a down payment. Moreover, though mortgage rates are expected to rise, they will still be very low on a historical basis.
Payrolls Finally See Surge
With the delta variant receding, employment growth rebounded in October and payrolls added 531,000 jobs. Also, the totals for August and September were revised higher. Goods-producing industries logged strong gains, while leisure/hospitality rebounded somewhat. Economists had predicted a jump in payroll gains would coincide with back-to-school activity in September; it appears they were off by one month. Average gains for the past three months are now a solid 442,000. With the labor market tightening to an unemployment rate of 4.6 percent, upward wage pressures are apparent. Growth in average hourly earnings for all workers increased to 4.9 percent over the 12 months since October 2020.
Preliminary Reading Shows Third-Quarter GDP Stall
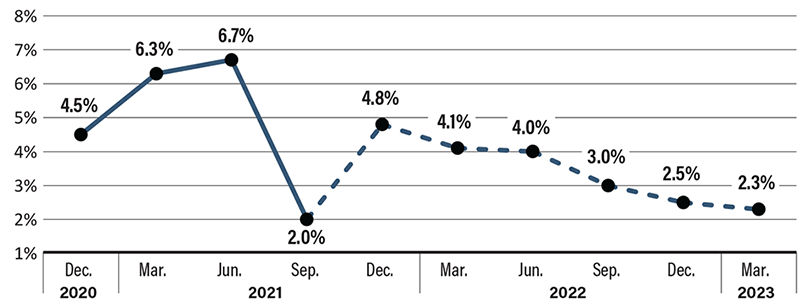
U.S. gross domestic product slowed to a disappointing 2 percent in the third quarter, below consensus projections, according to the Bureau of Economic Analysis’ preliminary estimate. The weakness was even more pronounced as inventory accumulation accounted for all the growth. At the start of the quarter, before the delta variant was evident, economists expected real GDP of near 6 percent.
Consumer spending rose at its slowest pace since the recovery began as durable goods spending fell sharply. Trade was a net drag. Federal government spending fell as fiscal support shrank. Growth was dominated by inventories—yet even they shrank, just less than in the prior quarter. The weakness should prove temporary, although the rebound may be stymied as supply constraints continue into next year.
Inflation has spiked, but also likely peaked. Look for it to moderate later this year. Rising commodity and industrial prices should also settle down by early next year as the scrambled supply chains are straightened out. There will be payback as the various government forbearance measures for mortgage and student loan borrowers and the moratorium on foreclosures and rental evictions expires, but these will pale by comparison to the growth.
Real Gross Domestic Product Growth
(Current and Projected)
Recent Economic Releases
| Indicator | Prior period | Current period (forecast) | Current period (actual) |
|---|---|---|---|
| S&P CoreLogic Case-Schiller 20-City Index (Aug.) (YoY) | 19.95% | 20.00% | 19.66% |
| U.S. Real GDP (Q3) (Prelim. Est.) | 6.7% | 2.6% | 2.0% |
| Nonfarm Payrolls (Oct.) | 312,00 | 450,000 | 531,000 |