economy
November 29, 2021
Eyes on the Economy: Industrial Production, Homebuilder Confidence, Existing-Home Sales

Industrial Production Sparks
U.S. industrial production bounced back in October after the lingering effect of Hurricane Ida was a significant drag in September. The indicator posted a 1.6 percent increase in October, almost doubling the market consensus forecast of 0.9 percent. In addition, total capacity utilization rose 1.2 percentage points to 76.4 percent. Manufacturing capacity utilization was up to 76.7 percent from 75.8 percent.
Supply-chain issues are limiting the recovery in manufacturing output, but there are tentative signs that conditions have leveled off. However, expect the bottlenecks to extend through the second half of 2022. The issue is exacerbated as businesses double or triple their orders in anticipation that there won’t be a noticeable improvement for a while, which puts even more pressure on goods shipments. The recovery could be cut short by inventory imbalances that might lead to a correction if businesses are caught with excess inventories in a couple of years as they over-order today to compensate for the delays, which has caused recessions in the past and is a symptom of a boom-bust cycle.
Homebuilders Still Confident
Homebuilder confidence edged up 3 points to 83 in November. Extremely low inventories and strong demand pushed up the National Association of Home Builders (NAHB) Housing Market Index, which remains well above the 50-point threshold that marks positive building conditions. Builders will have to contend with lot, material and labor shortages in the short term. Lot availability is at a multi-decade low, forcing new construction farther away from large population centers. NAHB estimates the industry has more than 330,000 open positions. Labor shortages are limiting the number of projects companies can take on. Lumber prices have dropped considerably from their all-time high earlier this year but remain above the historical average.
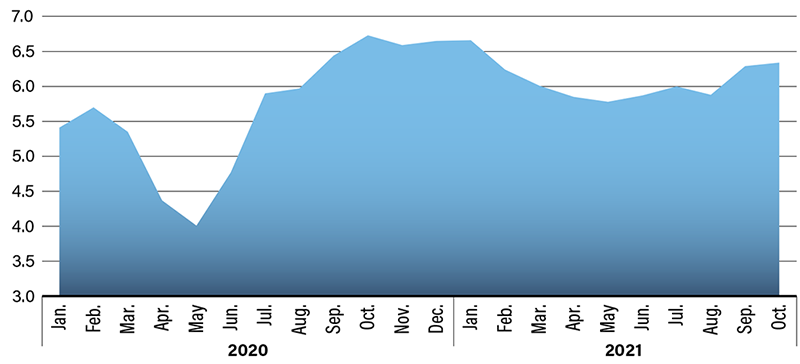
Existing-Home Sales Surprise Market with Jump
Sales of previously owned U.S. homes rose unexpectedly in October to the highest level since January, pointing to healthy demand as more buyers take advantage of stronger job growth and low mortgage rates. While the monthly pace of sales has settled back after reaching a 14-year high a year ago, it’s well above pre-pandemic levels. Sales are on track to exceed 6 million this year, which would be the strongest showing since 2006. The median selling price rose to $353,900, which is more than 13 percent higher on a year-ago basis. September’s median selling price was $351,200.
Demographic trends should prop up short-term housing demand. The bulk of millennials are entering their prime first-time home buyer age. Additionally, the 30-year fixed mortgage rate remains very low, reducing costs associated with buying a home. However, after more than a year of double-digit price growth, some home buyers are getting sidelined due to affordability issues. Potential buyers will continue to find it challenging to find a home that meets their budget and needs. Furthermore, the new-home market is lending little support. New-home construction cannot keep up with demand and has pushed up prices.
Existing-Home Sales
(Seasonally Adjusted Annual Rate, in Millions)
Recent Economic Releases
| Indicator | Prior period | Current period (forecast) | Current period (actual) |
|---|---|---|---|
| Industrial Production (Oct.) (MoM) | -1.3% | 0.9% | 1.6% |
| NAHB Housing Market Index (Nov.) | 80 | 80 | 83 |
| Existing-Home Sales (Oct.) | 6.29M | 6.20M | 6.34M |