economy
April 5, 2021
Eyes on the Economy: Interest Rates, Home Sales, Labor Market

Fed: Overnight Rate on Hold
While a lot can change over the next two years, the current Federal Reserve dot plot indicates the Fed’s most powerful tool, the federal funds rate, is expected to remain steady until the second quarter of 2023. At its March meeting, seven Federal Open Market Committee members anticipated raising rates in 2023, up from five in January.
The Fed has three conditions to raise interest rates: a job market consistent with maximum employment, inflation at a sustainable rate of 2 percent and evidence that inflation will continue to run above 2 percent. The last point is a little subjective. The Fed has an eye on not only the unemployment rate and labor force flows, but also the prime employment-to-population ratio, U-6 unemployment rate and wage growth among other indicators. The labor market is the main focus right now because that’s the economic engine that is going to drive this economy in the second half of 2021.
Existing-Home Sales Slow
The housing market is decelerating after existing-home sales peaked in January near their highest level in 14 years. The 30-year fixed mortgage rate finished February at 2.97 percent, up around 30 basis points from the start of 2021, and it’s been trending higher through March, leading to a decline in mortgage refinance and purchase applications.
With long-term interest rates trending upward, look for higher home financing costs to slow demand. In addition, the dwindling supply of available homes will begin to eat away at sales. Seasonally adjusted existing-home inventory fell to 1.12 million units in February—the lowest level in more than 20 years. Even though new-housing construction climbed in 2020, it remains insufficient to overcome the supply challenges. Despite these hurdles, expect existing-home sales to advance slightly in 2021 as the broader economy accelerates.
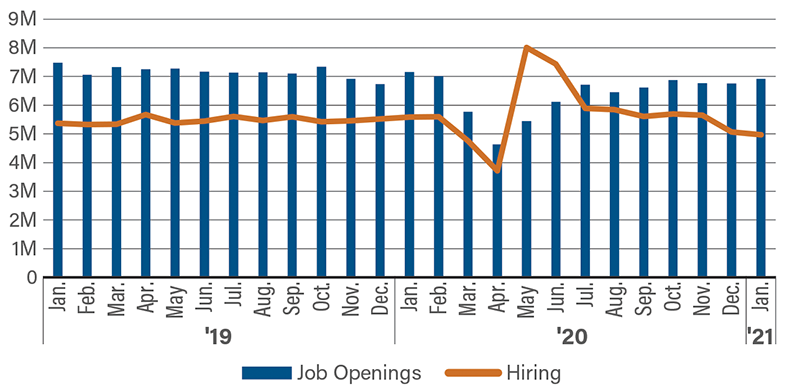
Job Openings Rise But Labor Market Remains Flat
January job openings edged up to 6.9 million, which was just slightly below the year-ago tally of 7.5 million. Hiring, however, fell to 5.3 million from 5.4 million a year ago. Unfortunately, hiring has lagged as employers seem to be advertising openings but are still not confident enough to commit to hiring.
Job openings have trended higher since mid-2020, closing in on 7 million. This compares with a monthly pace of 7 million to 7.5 million prior to the pandemic. The high demand for workers is a stark contrast to the experience after the Great Recession when it took five years for job openings to rebound. Today’s pace suggests the labor market may quickly right itself once the country achieves herd immunity.
The jobs picture is mixed across industries. The leisure/hospitality and government sectors are still not expanding, but others are more ambitious. Manufacturing and professional/business services are expanding. The combination of more shots in arms from vaccinations and a shot in the arm of the economy from fiscal stimulus should allow the economy to come roaring back in the coming quarters.
Labor Market (January 2019–January 2021)
Recent Economic Releases
| Indicator | Prior period | Current period (forecast) | Current period (actual) |
|---|---|---|---|
| JOLTS Job Openings (Jan.) | 6.65M | 6.70M | 6.92M |
| FOMC Overnight Rate | 0.25% | 0.25% | 0.25% |
| Existing-Home Sales (Feb.) | 6.69M | 6.49M | 6.22M |
Key Interest Rates
| 3/29/21 | 3/22/21 | Change | |
|---|---|---|---|
| Fed Funds | 0.25% | 0.25% | -- |
| 1-mo. Libor | 0.11% | 0.11% | -- |
| 3-mo. Libor | 0.20% | 0.18% | 0.02 |
| 2-yr. UST | 0.14% | 0.17% | -0.03 |
| 5-yr. UST | 0.85% | 0.86% | -0.01 |
| 10-yr. UST | 1.67% | 1.59% | 0.08 |
| 30-yr. UST | 2.37% | 2.31% | 0.06 |
Rate Forecast - Futures Market
| Q2-21 | Q3-21 | Q4-21 | Q1-22 | |
|---|---|---|---|---|
| Fed Funds | 0.25% | 0.25% | 0.25% | 0.25% |
| 1-mo. Libor | 0.10% | 0.10% | 0.20% | 0.20% |
| 3-mo. Libor | 0.20% | 0.20% | 0.30% | 0.30% |
| 2-yr. UST | 0.30% | 0.30% | 0.40% | 0.40% |
| 5-yr. UST | 1.00% | 1.10% | 1.20% | 1.20% |
| 10-yr. UST | 1.52% | 1.58% | 1.67% | 1.67% |
| 30-yr. UST | 2.53% | 2.60% | 2.70% | 2.70% |