economy
June 1, 2021
Eyes on the Economy: New Homes, Existing Homes, Jobless Claims

New-Home Builds Slow
April U.S. residential construction data came in weaker than expected. Housing starts dipped from 1.733 million annualized units in March to 1.569 million annualized units—a 9.5 percent decline. Though April’s data came in under the consensus forecast of 1.710 million annualized units, it is still a healthy margin above the 2018–2019 average of 1.269 million units. Fundamentals suggest demand for housing will be strong throughout 2021.
Home loans remain attractive as rates for 30-year, fixed-rate mortgages inched down to 3.11 percent last week. While this is more than a quarter-point higher than December’s 2.86 percent average, it’s a generationally low rate that should juice building and borrowing. Rising construction costs and broader inflation uncertainties pose a downside risk. Yields on 10-year U.S. Treasurys have crept up. Should runaway price fears take further hold or if the Fed surprises with an unexpected slowdown in asset purchases, yields will jump. Rule-of-thumb modeling suggests that a 100-basis-point increase in the 10-year yield will create a 77-basis-point increase in mortgage rates.
Existing-Home Sales Fall
Existing-home sales dropped 2.7 percent in April to 5.85 million units annualized, falling back near the level reached in July 2020. Sales were lower in all census regions with the exception of the Midwest, which recorded a slight gain. House prices are up 12 percent this year, according to the S&P CoreLogic Case-Shiller Home Price Index—marking the strongest pace since early 2006 during the height of the last housing boom. New-home construction has been insufficient to fill the supply gap left by the existing-home market despite the historically narrow price premium between the median existing home and median new home prices. As the economy steadily returns to normalcy, expect existing-home sales to clock in at approximately 6.3 million units in 2021, up from the approximately 5.7 million units registered in 2020.
U.S. Jobless Claims Continue To Show Improvement
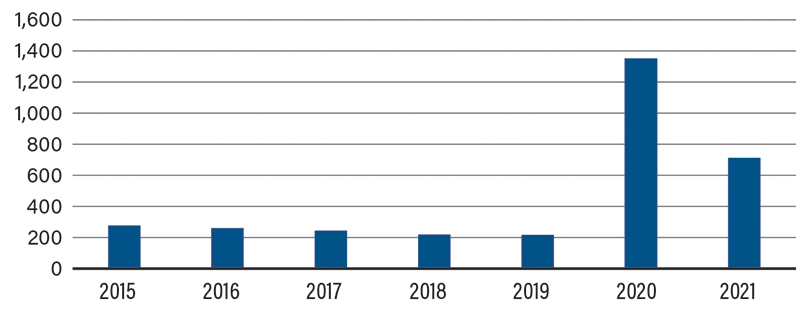
According to CenturyLinkQuote.com, “How do I file for unemployment?” was the most Googled question nationwide in 2020. Thankfully, this is starting to change for 2021, as jobless claims for the week ended May 15 dropped to a pandemic low of 444,000, as reported by the Labor Department. Moving forward, there are ample signs of recovery. Most notably, the International Monetary Fund revised the U.S. growth rate to 7.2 percent from 3.6 percent. Food insecurity, which has hovered near historic highs for much of the pandemic, is decreasing. The number of families behind on rent fell by more than 2 million in March. And, believe it or not, the S&P 500 has notched at least 21 records since President Joe Biden took office. Year-to-date return is hovering near 10 percent. Business optimism is bouncing back in the manufacturing and service sectors. Consumer confidence and retail sales have surged. That’s not to say there won’t be pitfalls along the way. A fresh reminder that the economy is far from healed was April’s disappointing nonfarm payroll number of 266,000—far below the 1 million new jobs economists were anticipating. However, the tide has turned and we expect to see continued improvement as jobless claims fall.
Annual Weekly Average of Jobless Claims (Numbers in Thousands)
Recent Economic Releases
| Indicator | Prior period | Current period (forecast) | Current period (actual) |
|---|---|---|---|
| New Residential Construction (Apr.) (Annualized) | 1,733K | 1,710K | 1,569K |
| Existing-Home Sales (Apr.) (Annualized) | 6.01M | 6.09M | 5.85M |
| Jobless Claims (Week Ending May 15) | 473K | 457K | 444K |
Key Interest Rates
| 5/24/21 | 5/17/21 | Change | |
|---|---|---|---|
| Fed Funds | 0.25% | 0.25% | -- |
| 1-mo. Libor | 0.09% | 0.10% | (0.01) |
| 3-mo. Libor | 0.14% | 0.15% | (0.01) |
| 2-yr. UST | 0.17% | 0.16% | 0.01 |
| 5-yr. UST | 0.84% | 0.84% | -- |
| 10-yr. UST | 1.63% | 1.64% | (0.01) |
| 30-yr. UST | 2.33% | 2.36% | (0.03) |
Rate Forecast - Futures Market
| Q2-21 | Q3-21 | Q4-21 | Q1-22 | |
|---|---|---|---|---|
| Fed Funds | 0.25% | 0.25% | 0.25% | 0.25% |
| 1-mo. Libor | 0.12% | 0.15% | 0.20% | 0.20% |
| 3-mo. Libor | 0.20% | 0.25% | 0.30% | 0.30% |
| 2-yr. UST | 0.30% | 0.30% | 0.40% | 0.40% |
| 5-yr. UST | 1.00% | 1.10% | 1.20% | 1.20% |
| 10-yr. UST | 1.78% | 1.85% | 1.95% | 1.95% |
| 30-yr. UST | 2.53% | 2.60% | 2.70% | 2.70% |