economy
August 9, 2021
Eyes on the Economy: Consumer Confidence, Housing, GDP Growth

Consumer Confidence Reverses Course
Consumer confidence snapped a string of U.S. economic data that had fallen short of market expectations. The Conference Board Consumer Confidence Index rose from a revised 128.9 in June to 129.1 in July—better than the consensus anticipated. Consumers’ assessment of the present situation increased from 159.6 to 160.3, while expectations were little changed. One important reason for the Conference Board index outperforming other measures of consumer confidence is its sensitivity to labor markets. Despite the still-high unemployment rate, job openings are plentiful, and consumers are recognizing this. The quit rate—the share of workers quitting their jobs voluntarily—has soared above pre-pandemic levels to a record high. Ironically, the University of Michigan consumer sentiment index did the exact opposite, falling from its cyclical peak. The cause for the decline was the rise in gasoline prices, which sparked inflation worries. Fears around the COVID-19 delta variant are also likely weighing on the index. Confidence measures are expected to be a mixed bag for the remainder of the year.
GDP Remains Strong
Real GDP remained at a boom-like annualized growth rate of more than 6 percent in the second quarter, slightly topping its first-quarter pace. Even with stimulus fading and the COVID-19 delta variant causing increases in infection rates, U.S. economic growth will remain strong. This year, and next, will be the strongest two years of growth since 1950-1951, at the height of the post-World War II economic boom. The virus variant will do meaningful economic damage if it causes people to resume sheltering in place and forces schools to remain online when the school year starts in a few weeks. The virus could also exacerbate problems with global supply chains and delay when people go back to work. Other threats include potentially overvalued equity and housing markets, with the possibility of a correction. Lastly, debt issues as forbearance ends could prove worse than expected.
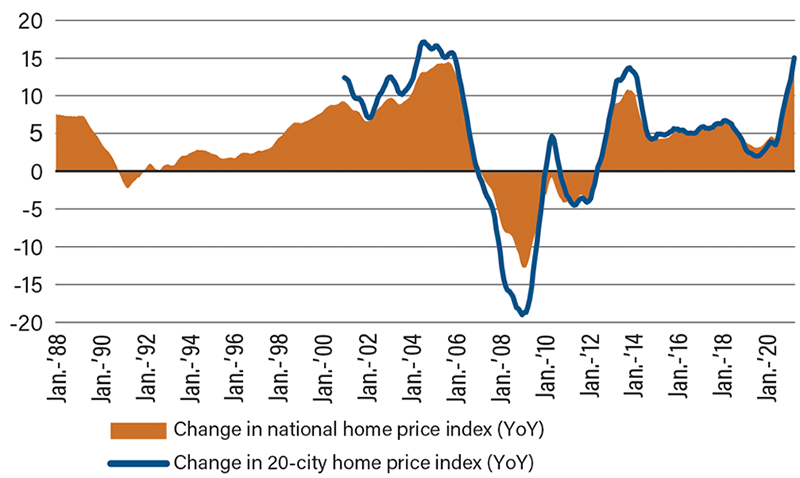
Housing Still Booming
The housing market is in the strongest boom in more than 15 years as price growth hits its most robust pace in recent memory. The breadth of the expansion is broad-based, with all 20 cities included in the index recording double-digit gains on a year-over-year basis. Appreciation remains strongest in metro areas in the West and South, where both restricted supply and steadily rising demand have combined to push prices upward. The change in the 20-city home index is trending just under the 2005 high.
The primary driver behind higher prices remains the acute lack of housing inventory available for potential homebuyers. Builders navigated supply-side constraints better than anticipated and delivered a moderate boost in housing starts in June. All told, the market expects house prices to continue on an upward trajectory through the end of the year and into the next, albeit at a somewhat more modest pace compared with the past several quarters.
National and 20-City Home Price Percentage Changes
Recent Economic Releases
| Indicator | Prior period | Current period (forecast) | Current period (actual) |
|---|---|---|---|
| Conference Board Consumer Confidence | 128.9 | 123.9 | 129.1 |
| Annualized GDP (QoQ) | 6.4% | 8.4% | 6.5% |
| S&P CoreLogic CS 20-City (YoY) | 14.9% | 16.3% | 17.0% |
Key Interest Rates
| 8/2/21 | 7/26/21 | Change | |
|---|---|---|---|
| Fed Funds | 0.25% | 0.25% | -- |
| 1-mo. Libor | 0.09% | 0.09% | -- |
| 3-mo. Libor | 0.12% | 0.13% | (0.01) |
| 2-yr. UST | 0.17% | 0.22% | (0.05) |
| 5-yr. UST | 0.66% | 0.73% | (0.07) |
| 10-yr. UST | 1.20% | 1.29% | (0.09) |
| 30-yr. UST | 1.60% | 1.93% | (0.33) |
Rate Forecast - Futures Market
| Q3-21 | Q4-21 | Q1-22 | Q2-22 | |
|---|---|---|---|---|
| Fed Funds | 0.25% | 0.25% | 0.25% | 0.25% |
| 1-mo. Libor | 0.10% | 0.12% | 0.15% | 0.20% |
| 3-mo. Libor | 0.20% | 0.20% | 0.25% | 0.30% |
| 2-yr. UST | 0.25% | 0.30% | 0.35% | 0.40% |
| 5-yr. UST | 0.80% | 0.90% | 1.00% | 1.10% |
| 10-yr. UST | 1.70% | 1.80% | 1.89% | 1.96% |
| 30-yr. UST | 2.45% | 2.30% | 2.40% | 2.50% |