economy
May 9, 2022
Eyes on the Economy: Cost of Employment, Trade Deficit, GDP
Cost of Employment Rises
More evidence came out for the first quarter of 2022 suggesting the labor market is overheated as employment costs increased 1.4 percent quarter-over-quarter and 4.5 percent on a year-over-year basis, the highest surge since 2001. Within the total compensation, wages and salaries climbed 4.7 percent while benefit costs climbed 4.1 percent.
The increases reflect not only a tight labor market, where employers have to raise compensation to attract workers, but also high inflation expectations, where employees demand higher compensation in anticipation of persistent inflation. Without intervention, it’s a never-ending cycle as higher employment costs lead to higher production costs, which then will be passed on to consumers through higher prices. The higher prices then push workers to demand higher compensation, and the cycle continues unless something disrupts it.
Trade Deficit Hits New High
The U.S. trade deficit reached a new record of $125.3 billion in March. Imports posted an increase of 11.5 percent to an all-time high of $295.6 billion. Take caution in reading the trade account as it is expressed in nominal, monetary values. Thus, increases may be largely driven by higher prices across the world. One thing the figures tell us is that U.S. demand in nominal terms outpaced the rest of the world.
The positive side of the imports figure is that it may suggest supply-chain pressure was eased as goods from abroad were flowing in. On the other hand, imports rising faster than exports may also suggest the U.S. trade account is bearing the consequences of high inflation and a strong dollar, making American-made goods more expensive relative to foreign goods. This is the sixth consecutive quarter that the trade deficit subtracted from gross domestic product (GDP)—the longest stretch since early 2016 and a concerning trend.
Surprise: Economy Sees Negative Growth in First Quarter
The U.S. economy unexpectedly contracted at an annualized rate of 1.4 percent in the first quarter of 2022, driven by the trade deficit, change in inventory and government expenditure. Personal consumption, the largest component of GDP, grew at an annualized rate of 2.7 percent. Be cautious in reading this figure as it doesn’t distinguish between more units of items being consumed and higher prices of the same units being consumed. The former reflects growth in living standards while the latter reflects high inflation.
The decline in government expenditure was warranted as COVID-relief spending came to an end. The rising trade deficit and declining private inventory, however, are cause for concern. Despite many dismissing it as a volatile factor, change in inventory is an important leading indicator, especially at a time when the economy is fragile. The account measures how much companies increase their inventories in anticipation of sales. A decline indicates that businesses expect slowing demand. With high inflation in the picture, it is an important puzzle piece in understanding what is coming as consumers battle price pressure. Nonetheless, a single quarter of negative growth does not cast a spell on the economy with fundamentals such as employment and business investment remaining strong.
Contributions to Gross Domestic Product (GDP) Growth
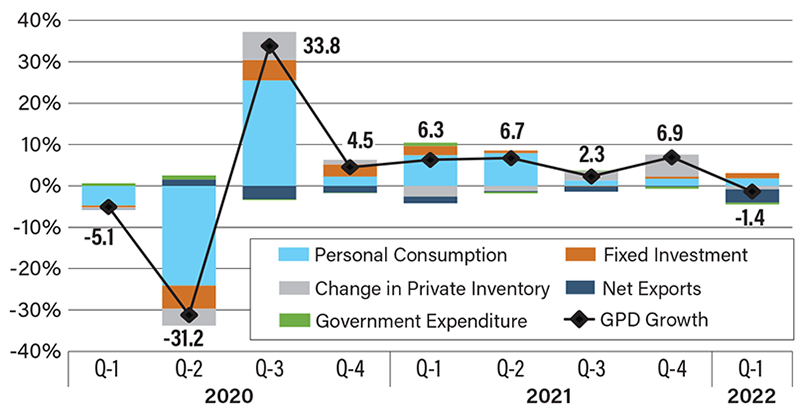
Source: U.S. Bureau of Economic Analysis
Recent Economic Releases
| Indicator | Prior period | Current period (forecast) | Current period (actual) |
|---|---|---|---|
| Employment Cost Index (Q1)(QoQ) | 1.0% | 1.1% | 1.4% |
| Goods Trade Balance (Mar.)(MoM) | $-106.35B | $-105B | $-125.32B |
| GDP Annualized (Q1)(QoQ) | 6.9% | 1.1% | -1.4% |
