economy
December 13, 2021
Eyes on the Economy: GDP, Jobs, Inflation, Confidence
GDP Slows in Third Quarter, So Does Spending, Job Losses
The economy suffered in the third quarter from the spreading delta variant, fading economic stimulus and Hurricane Ida. Real gross domestic product (GDP) growth came in at only 2.1 percent on an annualized basis (down from 6.7 percent in the second quarter)—and without a smaller inventory drawdown, the economy would have stagnated. At the start of the quarter, before delta was evident, market consensus anticipated real GDP growth close to 6 percent.
On the jobs front, while initial unemployment claims dropped below 200,000 (the lowest reading in 50 years) in mid-November, they rebounded to 222,000 the next week. Monthly job gains have slowed dramatically, as evidenced by November’s reading of 210,000 nonfarm payroll jobs—the smallest increase for the year.
In October, consumer spending rose at its slowest pace since the recovery began as durable goods spending fell sharply. The U.S. economy is primarily service-based—at 60 percent—so the fall in durable goods spending was not surprising since durable goods, by definition, last for years. Just how many cars, boats and refrigerators does an average American household need?
The slowdown can also be attributed to snarled global supply chains that stymied buyers and got even more jumbled by the delta wave. In Asia, where many of the supply chains begin, the virus variant hit especially hard. Supply-chain problems have exacerbated widespread shortages for many goods and caused inflation to surge.
Inflation has spiked, but also likely peaked. Commodity and industrial prices should settle down by early 2022 as the supply sides of those markets rebound and scrambled supply chains are straightened out, which would unleash more U.S. production next year.
Inflation Is Rising; Consumer Confidence Is Sagging
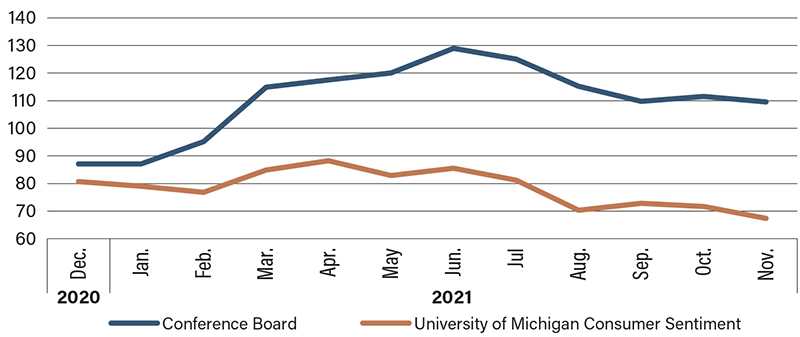
While there are several positives currently happening with the economy, including strong wage growth, record stock markets, a red-hot housing market and many U.S. households flush with cash, there is one problem weighing on consumer confidence: rising inflation. The Personal Consumption Expenditures (PCE) price index for October increased 5.0 percent from a year ago, reflecting increases in both goods and services. Energy prices skyrocketed 30.2 percent while food prices jumped 4.8 percent on a year-ago basis. Excluding food and energy, the PCE index for October increased 4.1 percent year-over-year. The rising costs of fuel, food and clothing cause inflation to take a bite out of every American’s disposable income. As a result, both the Conference Board and the University of Michigan Consumer Sentiment indexes are suffering. While confidence measures don’t tell us anything about underlying economic growth, they do offer a glimpse of consumer expectations going forward.
The COVID-19 omicron variant adds a new measure of uncertainty to the outlook for both the U.S. and global economies, although it is too soon to adequately quantify that risk. Consumer confidence will react accordingly. Don’t forget: A confident consumer is one that consumes, and consumption is the main driver of U.S. economic growth.
Consumer Confidence Indexes
Recent Economic Releases
| Indicator | Prior period | Current period (forecast) | Current period (actual) |
|---|---|---|---|
| Nonfarm Payrolls (Nov.) (MoM) | 546K | 573K | 210K |
| Gross Domestic Product, Annualized (Q3 2nd Est.) (QoQ) | 6.7% | 2.2% | 2.1% |
| Personal Consumption Expenditures Index (Oct.) (YoY) | 4.4% | 5.1% | 5.0% |
| University of Michigan Consumer Sentiment (Nov.) | 66.8 | 66.9 | 67.4 |