economy
April 12, 2022
Eyes on the Economy: Jobs, Household Finances, Consumer Sentiment

Labor Market Stays Strong
Despite worries over the economy, the United States added 431,000 jobs in March—well below forecast but still robust. The unemployment rate continued to drop, settling at 3.6 percent.
The strong job figures further support the Federal Reserve’s assessment of the labor market. Demand for workers remains high while supply continues to fall short. To close the gap, U.S. employers are offering higher wages to lure Americans back to work.
With COVID-19 restrictions being phased out and inflationary pressure mounting on income, hopefully more Americans will have strong incentive to rejoin the labor force. If the labor market continues this momentum, supply and demand for workers may soon reach a new equilibrium, which will contribute to restoring the U.S. supply chain.
U.S. Households Are in Solid Financial Positions
Although inflation, geopolitical instability and the prospect of more Federal Reserve rate hikes have left many with gloomy economic outlooks, Americans are entering this monetary tightening period in solid financial positions. The latest data suggest households ended last year with an all- time high aggregated net worth of more than $15 trillion, mostly driven by last year’s rising values of equities and real estate.
In February, personal income increased 0.5 percent from the previous month—slightly less than projected. The U.S. Bureau of Economic Analysis notes that the increase in employee compensation was partly offset by a decrease in government social benefits. In March, average hourly earnings saw a year-over-year increase of 5.6 percent. The gains reflect increases in wages and salaries as employers try to attract workers in a tight labor market. Overall, income has continued to advance.
Consumer Sentiment Worsens as High Inflation Persists
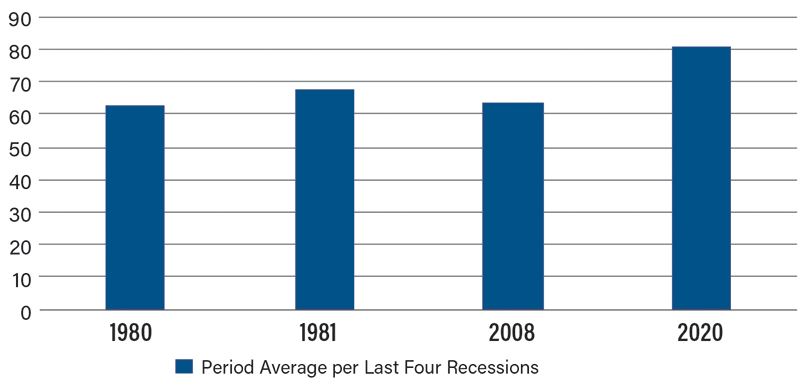
Figures for jobs, income and household finances seem to suggest a resilient economy. However, consumers disagree. In March, consumer sentiment declined to 59.4—the lowest in more than 10 years—with inflation primarily driving the rising pessimism.
Consumers rightly feel record-high inflation has reduced their standards of living. This sentiment is backed by data estimated by Bloomberg Economics, which suggest the average U.S. household has to spend an extra $5,200 this year for the same consumption basket compared to last year.
Despite skyrocketing prices, consumers continue to spend on goods, dine out at restaurants, travel and look to buy new homes. It is possible the high savings accumulated during the COVID-19 period have provided consumers with a cushion, but it is only matter of time before high prices dry out their savings. In fact, there are signs personal spending may be slowing as February’s month-over-month increase of 0.2 percent is below forecast and significantly lower than 2.7 percent in January.
If wage growth lags behind inflation, U.S. households soon will reach a breaking point—if they have not already. Look for changes in spending levels as consumers no longer can keep up with inflation and Fed rate hikes start impacting demand.
University of Michigan Consumer Sentiment Index
Recent Economic Releases
| Indicator | Prior period | Current period (forecast) | Current period (actual) |
|---|---|---|---|
| Nonfarm Payrolls (Mar.) (MoM) | 750K | 460K | 431K |
| Unemployment Rate (Mar.) | 3.80% | 3.70% | 3.60% |
| Average Hourly Earnings (Mar.) (YoY) | 5.20% | 5.50% | 5.60% |
| University of Michigan Consumer Sentiment (Mar.) | 62.8 | 59.7 | 59.4 |
