For decades, businesses were rewarded for becoming leaner. They minimized inventories, concentrated production where costs were lowest and added capacity only when demand clearly required it. The model was efficient under stable conditions but vulnerable when conditions became volatile.
The COVID-19 pandemic exposed that vulnerability. Wars, trade disputes, commodity volatility and repeated supply disruptions have since reinforced the lesson. Manufacturers, suppliers and electric utilities are responding with more inventory, additional sources of supply, new capacity and longer planning horizons. These decisions improve resilience, but they also carry a cost. The economy is increasingly paying a resilience premium: the expense of being prepared for a riskier environment.
CFC’s new Grid Price Index (GPI) reveals that changing cost structure through the equipment electric cooperatives use to build and maintain the distribution grid. Based on cost data reported by participating cooperative suppliers, it measures the changing cost of a fixed basket that includes transformers, conductors, cable accessories, utility hardware, enclosures, pedestals and pads. The index uses 2019 as the reference period.
The First Inflationary Break
The GPI shows that the pandemic shock reached equipment prices with a delay. The overall index remained relatively close to its 2019 level through much of 2020, even as factory closures, transportation bottlenecks and shortages of metals and components were building beneath the surface. Global supply-chain stress eventually reached unprecedented levels: The Federal Reserve Bank of New York’s measure peaked at 4.3 standard deviations above its historical average in late 2021.
Those pressures became unmistakable in 2021 and 2022. Transformer prices rose from roughly their 2019 level at the end of 2020 to nearly 78% higher by December 2022. Distribution-transformer lead times expanded from approximately three to six months before the pandemic to 12 to 30 months by 2023, according to the U.S. Department of Energy. Specialized capacity, electrical-steel constraints, labor shortages and strong demand all contributed.
Conductors followed a more volatile path because their costs are closely tied to copper and aluminum. Compared with 2019 levels, the underground conductor subindex was nearly 71% higher in early 2023, while overhead conductors increased 117% by the end of 2022. Electric cooperatives were not simply experiencing general inflation. They were purchasing equipment situated at the intersection of several bottlenecks: metals, transportation, industrial production and highly specialized manufacturing capacity.
Supply Chains Improved but Prices Stayed High
Conditions began to improve in 2023. Shipping congestion eased, transportation costs declined and global demand for goods moderated. The overall GPI cumulative inflation fell from approximately 87% at the end of 2022 to about 73% in early 2023. Overhead conductors declined especially sharply, from roughly 117% to 73%.
However, supply chain normalization did not restore the old price level. By the first quarter of 2026, transformers still cost approximately 93% more than in 2019. Underground conductors were about 74% higher and overhead conductors about 72% higher. Underground cable accessories were approximately 127% higher, utility hardware 108% higher and enclosures, pedestals and pads about 165% higher.
Year-over-year GPI inflation declined after supply chain issues were restored, but cumulative inflation remained significantly higher than in 2019. Slower annual inflation means prices are increasing less rapidly; it does not restore the purchasing power of a budget based on 2019 costs.
A Second Cost Impulse
The GPI also suggests that equipment inflation did not end with the pandemic. After declining in early 2023, the overall index began increasing again throughout 2024 and 2025. It eased in the first quarter of 2026 but ticked up again in the second quarter.
This second rise appears different from the first. Pandemic logistics are no longer the central explanation. Utilities are replacing aging infrastructure, strengthening reliability and preparing for load growth. Manufacturers also face higher labor, energy, material and financing costs, while capacity can take years to expand.
Trade policy has become another source of pressure. Section 232 tariffs on many steel and aluminum imports increased from 25% to 50% in June 2025, and subsequent measures expanded the tariff exposure of additional metal products and derivatives. Several metal-intensive GPI categories accelerated later in 2025: underground conductors subindex rose from roughly 152 in the second quarter to 181 in the fourth, overhead conductors increased from about 144 to 174, and enclosures, pedestals and pads climbed from approximately 239 to nearly 293.
The timing does not prove that tariffs caused those increases. Commodity markets, contracts, hedging and inventory positions could drive costs. However, the correlation with timing suggests that trade policy is an important factor to monitor alongside equipment demand and manufacturing capacity.
The Resilience Premium
The broader economic change is visible throughout the electric equipment supply chain. Manufacturers are investing in automation and additional capacity, sometimes before existing facilities reach the usage rates that historically triggered expansion. Cooperative suppliers are holding more inventory and adding warehouse space. Electric cooperatives are forecasting needs further ahead, reserving production slots years in advance and developing relationships with primary, secondary and tertiary suppliers.
These choices are prudent responses to greater risk. A transformer in inventory ties up capital, but an unavailable transformer can delay service or weaken reliability. Spare capacity can raise unit costs but shorten lead times during a surge. Supplier redundancy may sacrifice the lowest purchase price in exchange for continuity.
The GPI cannot isolate the exact portion of equipment inflation attributable to this resilience premium. Its movements also reflect commodities, labor, freight, tariffs, financing costs, product mix and demand. But the index shows the environment in which the trade-off must be managed: Equipment costs remain far above 2019 levels even after the worst supply chain disruptions passed.
Better Information for a Higher Cost Environment
That is the central value of the GPI. Broad measures such as the Consumer Price Index cannot show a cooperative how transformer prices differ from conductor prices or the inflation of the typical basket of equipment that cooperatives purchase. The GPI and its category subindices provide a more relevant benchmark for capital budgeting, procurement discussions and communication with boards and members.
Electric Distribution Equipment Faces Faster Price Increases Than Consumer Goods & Services
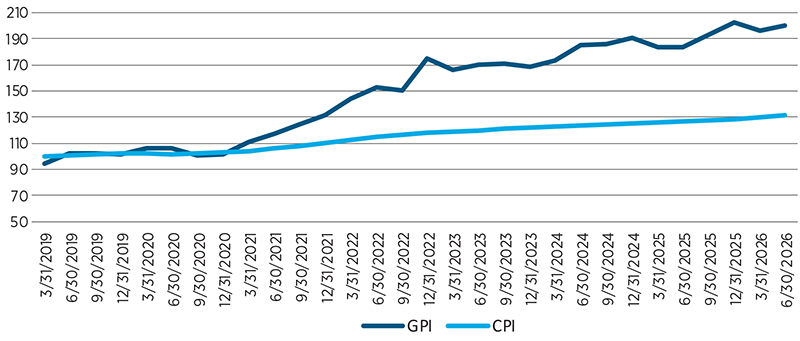
SOURCE: CFC Grid Price Index; Bureau of Labor Statistics.
Cooperatives must plan for a grid that is more expensive to build while deciding how much inventory, redundancy and advance purchasing are justified. Efficiency still matters, but efficiency without resilience can become extraordinarily expensive. The GPI gives cooperative leaders better information for finding the balance.