Eyes on the Economy: Sentiment, Home Prices, Inflation

Americans Are Pessimistic
The RealClearMarkets/TechnoMetrica Institute of Policy and Politics (TIPP) Economic Optimism Index declined to 49.1 in April from 49.8 in March, marking the second consecutive month in pessimistic territory and the lowest reading in six months. The decline was driven by a few factors. The subindex for six-month economic outlook, which measures how consumers perceive the economy's prospects, declined 2.6%. Confidence in federal economic policies dropped 2.5%. This subindex has been in the pessimistic territory for the past 44 months. Meanwhile, there was a slight improvement in the personal finance outlook from last month.
Overall, consumers have been pessimistic for over three years, except for the period between November 2024 and February 2025. Fears of inflation and an economic slowdown have weighed on consumers, with 79% reportedly worrying about inflation while 76% are concerned about an economic slowdown in the next 12 months.
However, housing starts declined 3.1% in October to a seasonally adjusted annual rate of 1.31 million units. October’s reading reflected an increase in average mortgage rates from 6.18% to 6.43% between September and October. Despite the Federal Reserve’s first federal funds rate cut in September, mortgage rates have trended back up. Even after the second Fed cut in November, mortgage rates continued on an upward trend as of November 21. Nonetheless, existing-home sales increased 2.9% in October from a year ago, marking the first annual increase in more than three years while median existing-home sales continued to grow. Overall, the housing market still faces an affordability crisis.
Home Prices Tick Up
The S&P CoreLogic Case-Shiller National Home Price Index recorded a 4.1% annual gain in January 2025, slightly up from December’s 4.0% annual gain. On a month-over-month basis, it rose 0.1%. The price gain was driven by several factors. Elevated mortgage rates and affordability constraints have weighed on buyer demand and market activity. Despite these challenges, certain metro areas, such as New York, Chicago and Boston, saw significant annual gains, with New York leading at a 7.7% increase.
Since housing is a necessity, demand is less price elastic. Existing homeowners who locked in low mortgage rates are less likely to sell their homes. This leads to an imbalance of market-pricing power between buyers and sellers. Meanwhile, inflationary pressures on homebuilders continue to keep the cost of building high, creating higher prices for new homes and leaving house hunters with only two options: Buy at high prices or stay in the rental market.
Inflation Remains Stubbornly Elevated
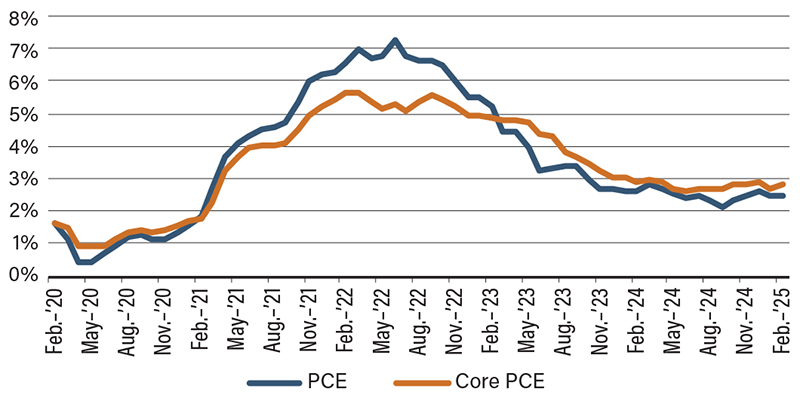
The Personal Consumption Expenditures (PCE) price index increased 2.5% year-over-year in February. On a month-over-month basis, the PCE index rose 0.3%. Excluding food and energy, core PCE inflation ticked up to 0.4% in February from 0.3% in January, putting the annual core inflation at 2.8%. Running slightly above expectations, core PCE inflation has been driven by persistent price pressures in housing and other core services.
The Federal Reserve has paused its rate cutting since the beginning of this year. The persistently elevated inflation readings suggest that the central bank may continue to put rate cuts on hold. Many forces are at play. Although tariffs are seen as inflationary, the Fed insisted that tariff-driven inflation was already accounted for in its forecast and expected such inflation to be “transitory.” Nonetheless, Goldman Sachs raised the probability of a U.S. recession within the next 12 months to 45%. It was 20% on March 30. The bank expects more rate cuts from the Fed as it sees low economic growth along with upended financial markets this year. If inflation persists while economic growth slows, the Fed may be facing stagflation, a scenario where none of its policy tools work.
Inflation Has Been Persistent

Source: U.S. Bureau of Labor Statistics.
Recent Economic Releases
| Indicator | Prior period | Current period (forecast) | Current period (actual) |
|---|---|---|---|
| RealClearMarkets/TIPP Economic Optimism Index (Apr.) | 49.8 | 50.1 | 49.1 |
| S&P CoreLogic Case-Shiller National Home Price Index (Jan.)(YoY) | 4.0% | N/A | 4.1% |
| PCE Price Index (Feb.)(YoY) | 2.5% | 2.5% | 2.5% |
| Core PCE Price Index (Feb.)(YoY) | 2.7% | 2.7% | 2.8% |
