economy
December 1, 2025
Eyes on the Economy: Home Sales, Construction, Labor Market

Existing-Home Sales Increase
Existing-home sales rose 1.2% month over month in October to a seasonally adjusted annual rate of 4.1 million, according to the National Association of Realtors. Sales climbed in the Midwest and South, remained flat in the Northeast and declined in the West. The monthly gain was driven by buyers capitalizing on lower mortgage rates despite the government shutdown. The average 30-year mortgage rate has been declining since the summer, reaching 6.37% for the week of November 17.
First-time buyers reportedly continued to face supply shortages in the Northeast and high prices in the West, while conditions remained more favorable in the Midwest and South due to greater affordability and inventory. The national median existing-home price reached $415,200—up 2.1% from a year ago—marking the 28th straight month of annual price gains. Inventory stood at 1.52 million units, down 0.7% from September but up 10.9% from a year earlier, representing a 4.4-month supply of unsold homes. Overall, the housing market is facing low supply and high prices despite easing mortgage rates.
Construction Spending Rises in August
U.S. construction spending rose 0.2% in August 2025, matching July’s upwardly revised gain and exceeding expectations of a slight decline. Residential construction led the increase, up 0.8%, offsetting a 0.2% drop in nonresidential activity. Within the nonresidential sector, spending decreased in manufacturing (0.9%), power (0.2%), highways and streets (0.2%) and transportation (0.5%), but increased 0.7% in educational facilities. Private construction climbed 0.3%, driven by residential gains, while public construction was little changed from July.
On a year-over-year basis, total construction spending fell 1.6%. For the first eight months of 2025, spending totaled $1.44 trillion, down 1.8% compared with the same period in 2024, reflecting ongoing weakness in nonresidential sectors despite resilience in housing and select infrastructure categories.
Labor Market: Weak Demand, Low Supply, High Wages
The U.S. economy added 119,000 jobs in September, reflecting minimal overall growth since April. Job gains continued in health care, food services and drinking places and social assistance, while the transportation, warehousing and federal government sectors saw declines. The unemployment rate held steady at 4.4%, with 7.6 million people unemployed—both slightly higher than a year earlier (4.1% and 6.9 million, respectively). The long-term unemployed, defined as being jobless for 27 weeks or more, stood at 1.8 million, representing 23.6% of the unemployed. The labor force participation rate (62.4%) and the employment-population ratio (59.7%) showed little movement over the month, though the latter was 0.4 percentage points lower than a year ago.
Average hourly earnings rose 0.2% month over month. On a year-over-year basis, wage growth increased 3.8% in September, the same growth rate as August. Although labor demand has softened significantly, wage inflation continues to run above pre-COVID levels, suggesting that both supply shortages and workers’ inflation expectations remain a force in the current labor market, where low hiring is met with labor shortages and workers who need higher pay to compensate for rising cost of living.
Percentage Change in Average Hourly Earnings, YoY
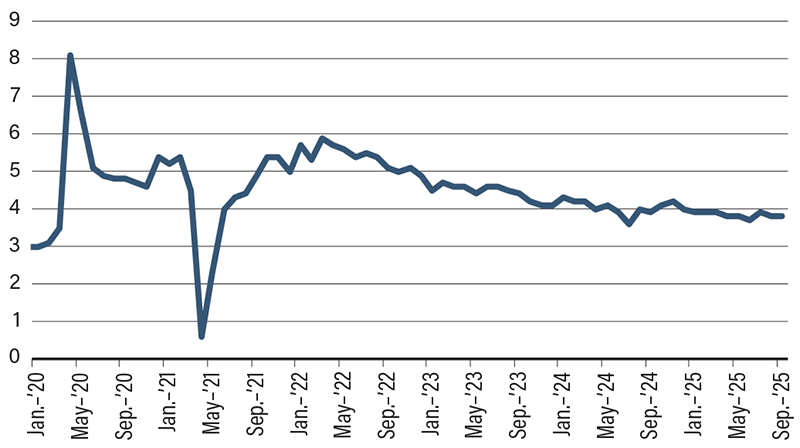
Source: Trading Economics.
Recent Economic Releases
| Indicator | Prior period | Current period (forecast) | Current period (actual) |
|---|---|---|---|
| Existing Home Sales (Oct.) | 4.05M | 4.08M | 4.10M |
| Construction Spending (Aug.)(MoM) | 0.2% | (0.1%) | 0.2% |
| Nonfarm Payroll (Sept.) | (4K) | 50K | 119K |
| Unemployment Rate (Sept.) | 4.3% | 4.3% | 4.4% |
