Eyes on the Economy: Expenditures, Labor Report, Trade

Expenditures Slow in April
The Personal Consumption Expenditures (PCE) Index rose 0.2% in April, marking a slowdown from March’s 0.7% increase. Consumer spending on utilities, housing, health care and food services increased, while nonprofit, financial services and insurance expenditures decreased. Overall services spending rose 0.4% compared with March’s 0.7%, while April goods spending declined 0.1% after the previous month’s expenditures surged in anticipation of U.S. tariffs and potential international retaliatory measures.
Weaker demand for goods in April is projected to continue throughout the year, with a consensus forecast of a 0.2% spending increase in June and 0.1% in September. Consumer spending is a key driver of economic growth, accounting for nearly 70% of U.S. gross domestic product. The stalling PCE growth rate underscores low consumer confidence levels reported by the University of Michigan in April and May.
Labor Report Shows Mixed Signs of Growth
The U.S. economy added 139,000 jobs in May, a slowdown from April’s 147,000 gains but above market forecasts of 130,000. Both March and April payroll gains were revised downward from previously reported levels. The private sector experienced its slowest growth since March 2023, adding only 37,000 jobs—compared with 60,000 in April—significantly lower than consensus forecasts of 115,000.
The unemployment rate remained constant at 4.2% for a third month as losses of 22,000 jobs in federal government and 8,000 in manufacturing were offset by gains in healthcare, hospitality and food services. Average hourly earnings have increased 3.9% since May 2024, maintaining a constant year-over-year growth rate in 2025. Overall, the labor market remains solid despite hiring slowdowns and disproportionate job losses in federal government. Unemployment rate and wage increases are projected to remain unchanged in June, while non-farm payrolls are expected to continue to increase at a slower rate.
US Imports, Trade Deficit Experience Record Decline
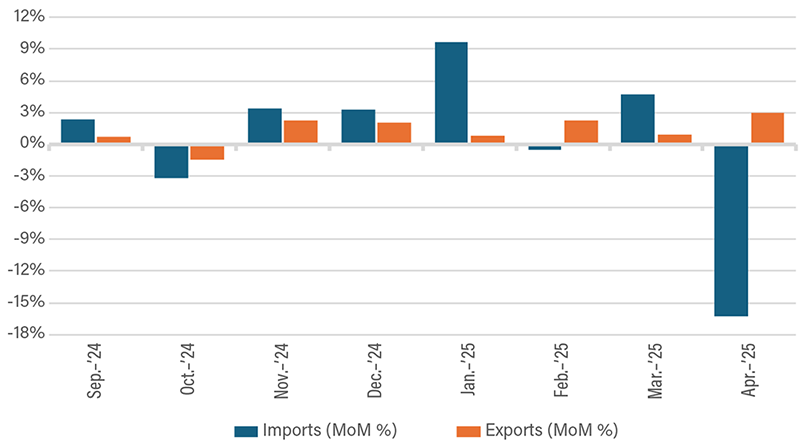
U.S. imports of goods and services fell to $351 billion in April as a result of tariff-induced trade shifts, marking a 16.3% drop from a record-high $419 billion in March—the largest monthly percentage decrease since February 1975. While service imports increased $0.5 billion, goods imports experienced a sharp decline of $68.9 billion driven primarily by decreases in pharmaceuticals, household goods, metals and motor vehicles. This decline reflects the impacts of tariffs enacted in early April after policy anticipation led to an imports rush, which inflated March numbers. The effects of prolonged uncertainty surrounding U.S. fiscal policy are expected to continue into May, with Bloomberg predicting an overall Q2 import decrease of 15.7%.
Conversely, U.S. exports increased 3% to $289.4 billion in April. This represents the fourth consecutive month of record-high exports, with metal products, gold and computers as the highest contributors to overall increases. Combined with the sharp decline in imports, these levels caused the trade deficit to fall 55% in April—the largest percentage collapse since February 1992. Extreme volatility in U.S. fiscal policy makes it difficult to determine if this decrease will persist as businesses continue to adjust to tariff changes and announcements.
US Imports vs. Exports—MoM Change Percentage

Source: Trading Economics.
Recent Economic Releases
| Indicator | Prior period | Current period (forecast) | Current period (actual) |
|---|---|---|---|
| Personal Consumption Expenditures (Apr.)(MoM) | 0.7% | 0.2% | 0.2% |
| U.S. Non-Farm Payroll Additions (May) | 147,000 | 130,000 | 139,000 |
| U.S. Imports (Apr.) | $419.4 B | $351.0 B | $351.0 B |
| U.S. Exports (Apr.) | $281.1 B | $284.4 B | $289.4 B |
