economy
May 17, 2021
Eyes on the Economy: Employment, Manufacturing and Payrolls

Employment Costs Rise
The Employment Cost Index (ECI) continues to provide the most realistic picture of what is happening to compensation and wages as a result of the COVID crisis, and the news is increasingly positive. The ECI rose 0.9 percent in the first quarter of 2021, marking an increase from the fourth quarter and beating expectations for a 0.7 percent gain. Other wage measures have produced misleading signals as a result of massive layoffs followed by strong job gains. Lower-paid workers bore a disproportionate share of layoffs, causing average hourly earnings to spike since the remaining pool of employed workers is paid more, on average.
The outlook for the labor market is improving with each new release. Average monthly job gains are now expected to surpass 500,000 in 2021 and slow to a still-impressive 285,000 next year, although April’s additions were disappointing. This pace of growth will allow employment to return to its pre-pandemic peak by the end of 2022. s year.
Manufacturing Index Falls
The Institute for Supply Management Manufacturing Index unexpectedly fell in April to 60.7 from 64.7 in March, but it remains elevated and the outlook is favorable for factory conditions this quarter. Across the board, the details were less impressive. New orders fell from 68 to 64.3 while production dropped from 68.1 to 62.5. The employment index also sank. Supplier deliveries slipped but are still high and will likely remain this way for the next several months. The prices-paid index rose from 85.6 to 89.6 as the number of commodities that are up in price and/or in short supply continues to grow. The bottlenecks are severe at times as companies and suppliers struggle to meet increasing levels of demand with longer lead times, rising commodity prices and worker shortages.
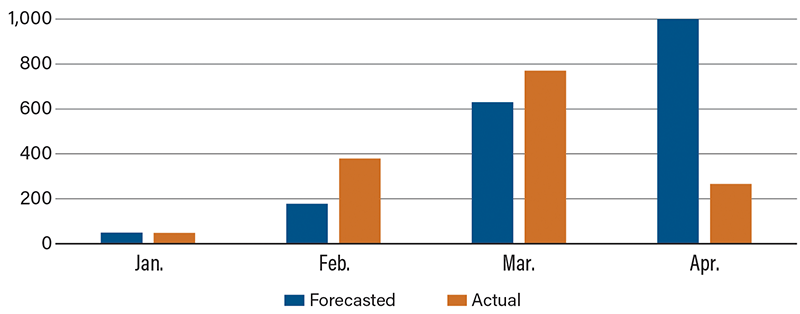
Payrolls Disappoint Big Time in April
Forecasting is tough, and prognosticators missed the mark big time for employment in the month of April as payroll came back far weaker than expected. In fact, nonfarm payroll predictions have been very challenging since January. The Bureau of Labor Statistics reported that 266,000 net new jobs were added—one-third of market expectations—while the unemployment rate edged up to 6.1 percent. Moreover, March’s figure was revised down to 770,000 from the 916,000 reported last month.
Goods producers, retailers, transportation/warehousing and temp help all shed jobs. Chip shortages have resulted in auto manufacturing declines, and the drought is not expected to resolve itself anytime soon. Furthermore, rising commodity prices also may be clamping down on activity. For example, surging lumber prices could be constraining construction activity despite very high demand for housing. This is compounded by worker shortages in many industries. Economists have put forth several different reasons for the delay in laborers returning to work, including childcare responsibilities, fear of catching the virus, generous unemployment compensation and the search for better job opportunities. Whatever the case may be, the hiring situation for businesses doesn’t appear to be ramping up as quickly as once anticipated.
Nonfarm Payrolls (Numbers in Thousands)
Recent Economic Releases
| Indicator | Prior period | Current period (forecast) | Current period (actual) |
|---|---|---|---|
| Employment Cost Index (Q1) | 0.7% | 0.7% | 0.9% |
| ISM Manufacturing Index (Apr.) (MoM) | 64.7% | 65.0% | 60.7% |
| Change in Nonfarm Payrolls (Apr.) (MoM) | 770K | 1,000K | 266K |
| Unemployment Rate | 6.0% | 5.8% | 6.1% |
Key Interest Rates
| 5/10/21 | 5/03/21 | Change | |
|---|---|---|---|
| Fed Funds | 0.25% | 0.25% | -- |
| 1-mo. Libor | 0.10% | 0.11% | (0.01) |
| 3-mo. Libor | 0.17% | 0.18% | (0.01) |
| 2-yr. UST | 0.14% | 0.16% | (0.02) |
| 5-yr. UST | 0.77% | 0.84% | (0.07) |
| 10-yr. UST | 1.60% | 1.63% | (0.03) |
| 30-yr. UST | 2.28% | 2.30% | (0.02) |
Rate Forecast - Futures Market
| Q2-21 | Q3-21 | Q4-21 | Q1-22 | |
|---|---|---|---|---|
| Fed Funds | 0.25% | 0.25% | 0.25% | 0.25% |
| 1-mo. Libor | 0.12% | 0.15% | 0.20% | 0.20% |
| 3-mo. Libor | 0.20% | 0.25% | 0.30% | 0.30% |
| 2-yr. UST | 0.30% | 0.30% | 0.40% | 0.40% |
| 5-yr. UST | 1.00% | 1.10% | 1.20% | 1.20% |
| 10-yr. UST | 1.78% | 1.85% | 1.95% | 1.95% |
| 30-yr. UST | 2.53% | 2.60% | 2.70% | 2.70% |