economy
September 7, 2021
Eyes on the Economy: GDP, Existing-Home Sales, Inflation

GDP Stays Strong
Real gross domestic product (GDP) remained above 6 percent in the second quarter, which slightly tops its first-quarter pace and is boom-like annualized growth. On a monthly basis, however, growth peaked in March and has been minimal ever since, according to a Moody’s estimate of monthly GDP. Growth will remain strong, but with stimulus fading, the COVID-19 delta variant spreading and unsustainably strong progress slowing, it’s no surprise the economy lost momentum in the second quarter.
Consumers led the charge in the first half of the quarter, and business investment was also robust. A deteriorating trade balance was an expected drag since the U.S. economy is well ahead of much of the rest of the world—besides China and some parts of Southeast Asia—in its recovery from the pandemic recession. This year and next will be the strongest two years of growth since 1950–1951 at the height of the post-World War II economic boom. Real GDP has fully recovered what it lost in the downturn. It took six quarters for real GDP to better its fourth-quarter 2019 pre-pandemic peak of just over $19 trillion. This recovery is substantially faster than the 14 quarters it took GDP to recover from the financial crisis and Great Recession in 2008.
Existing-Home Sales Remain Upbeat
Existing-home sales rose in July, adding to June’s gain and further reversing the downward trend that started at the beginning of 2021. After spiking in the first quarter, mortgage rates have been trending downward, lowering home financing costs and supporting housing demand. The 30-year, fixed-rate mortgage was below 3 percent throughout July and is now clocking near-generational lows. On the other hand, very tight housing supply remains an issue for potential buyers and is not likely to change anytime soon. There is a large cohort of millennials entering the prime home-buying years that will be a constant source of support throughout the 2020s. The tightening labor market and rising wages will also provide near-term support. Expect home sales to rise modestly within the next few years.
Federal Reserve: Still Betting Inflation Is Fleeting
U.S. inflation has accelerated, but the Federal Reserve is still in the camp that it will be transitory; therefore, the monetary policy implications are minimal. The headline Personal Consumption Expenditure (PCE) deflator rose 0.5 percent in June. Goods prices were up 0.7 percent for the month, compared with a 0.8 percent gain in May. Energy goods and services prices increased 1.5 percent in June after being unchanged in May. Food prices were up 0.8 percent, noticeably stronger than the past few months. Excluding food and energy, the PCE deflator increased 0.4 percent in June, matching consensus. Looking over a longer time horizon, the PCE deflator was up 4.2 percent on a year-ago basis in July, compared with 4.0 percent in June.
The most likely culprits driving inflation include persistent problems in global supply chains, rising oil prices and wage pressures. In each of these scenarios, monetary policy is of no help. The longer higher prices linger, the more inflation becomes embedded in expectations and contracts. This evolution would significantly complicate Fed policy-setting, making a tightening-induced recession more likely, which is what the Fed cannot afford to do.
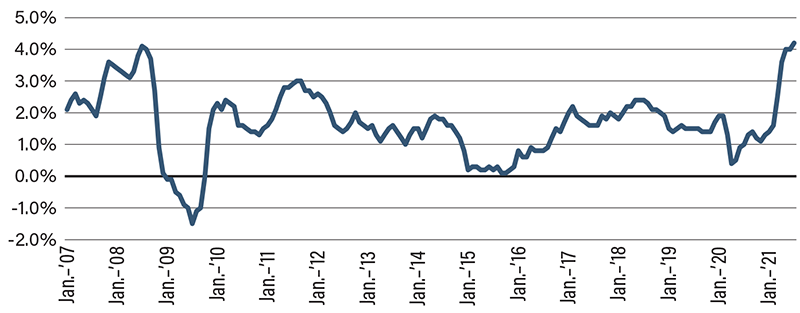
Gross Domestic Product Price Deflator
(A measure of the prices of U.S. goods and services, excluding imports.)
Recent Economic Releases
| Indicator | Prior period | Current period (forecast) | Current period (actual) |
|---|---|---|---|
| Existing-Home Sales (July) | 5.86 M | 5.83 M | 5.99 M |
| Real GDP Annualized (Q2) (QoQ) (2nd Release) | 6.5% | 6.7% | 6.6% |
| Core PCE (July) (YoY) | 4.0% | 4.1% | 4.2% |
Key Interest Rates
| 8/30/21 | 8/23/21 | Change | |
|---|---|---|---|
| Fed Funds | 0.25% | 0.25% | -- |
| 1-mo. Libor | 0.09% | 0.08% | 0.01 |
| 3-mo. Libor | 0.12% | 0.13% | (0.01) |
| 2-yr. UST | 0.22% | 0.23% | (0.01) |
| 5-yr. UST | 0.79% | 0.78% | 0.01 |
| 10-yr. UST | 1.31% | 1.25% | 0.06 |
| 30-yr. UST | 1.91% | 1.87% | 0.04 |
Rate Forecast - Futures Market
| Q3-21 | Q4-21 | Q1-22 | Q2-22 | |
|---|---|---|---|---|
| Fed Funds | 0.25% | 0.25% | 0.25% | 0.25% |
| 1-mo. Libor | 0.10% | 0.12% | 0.15% | 0.20% |
| 3-mo. Libor | 0.20% | 0.20% | 0.25% | 0.30% |
| 2-yr. UST | 0.25% | 0.30% | 0.35% | 0.40% |
| 5-yr. UST | 0.80% | 0.90% | 1.00% | 1.10% |
| 10-yr. UST | 1.70% | 1.80% | 1.89% | 1.96% |
| 30-yr. UST | 2.10% | 2.20% | 2.30% | 2.40% |