economy
January 11, 2021
Eyes on the Economy: GDP, Housing, Inflation

GDP Holds Steady in Q3
The pandemic created unprecedented volatility in U.S. gross domestic product (GDP) last year. The record-shattering 31.4 percent annual decline in second-quarter real GDP was followed by a similarly record-breaking 33.4 percent gain in the third quarter, according to the Bureau of Economic Analysis’s third estimate. The gain reversed about 75 percent of the prior decline.
Strength was widespread and seen in consumer spending, most investment components, exports and inventories. Government spending and imports were offsets. Expect the recovery to be similar to that seen after a natural disaster in which the economy shuts down, then there is a bounce in economic activity when it reopens. However, a lull follows the initial bounce as the secondary effects of the devastation kick in. In the case of COVID, that lull will be intensified by the resurgence of the virus.
Lawmakers’ agreement on a $900 billion fiscal rescue package came just in time to forestall a double-dip recession. With the additional fiscal support and Americans getting vaccinated, expect the economic recovery to find its legs by mid-2021.
Housing Starts Slow
The National Association of Realtors reported that the pending home sales index dipped 2.6 percent to 125.7 in November, the third straight monthly decline. Though the home sales index is up 16.4 percent nationally on a year-ago basis, the slowdown confirms that the market is cooling.
The U.S. housing market soared in 2020. Full-year statistics are not yet available, but house prices appreciated 5.6 percent through September, which is the fastest pace since 2013. Existing-home sales rocketed to 6.12 million units annualized in October, the highest level since November 2005 and close to the peak of the housing bubble that precipitated the Great Recession. However, overall activity cooled in the mortgage market in December, and rates are expected to be a tad higher in 2021.
Stalling Recovery Puts Ice on Inflation Outlook
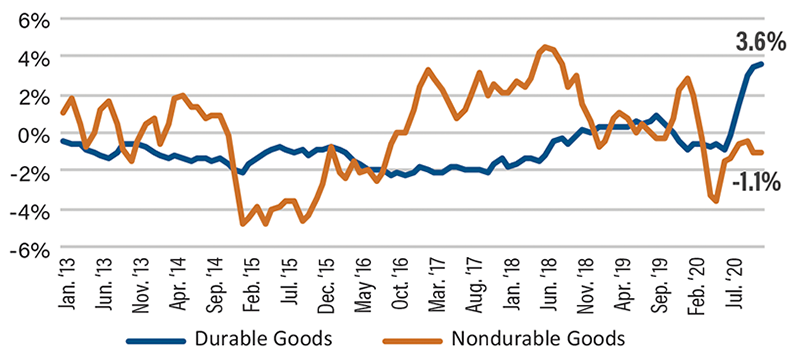
The headline Personal Consumption Expenditures (PCE) Price Index deflator was unchanged in November for the second consecutive month, and it’s up only 1.1 percent on a year-ago basis. Risks for inflation are slightly weighted to the upside in 2021 because of the additional fiscal stimulus approved in December. However, the forecast is tricky due to the divergence between durable and nondurable goods inflation. Consumer spending on cars, appliances and furniture is up while outlays for services like movie theaters, travel, education and daycare services have declined sharply.
Expect inflation to accelerate next year despite some drags, including the lingering impact of the pandemic on rents and slack in the labor market. The Federal Reserve won’t raise rates soon. In fact, the Fed’s new forward guidance suggests the central bank won’t be tapering its asset purchases in 2021. This will likely put additional downward pressure on the 10-year term premium and introduce additional downside risk to the forecast for the 10-year Treasury yield.
U.S. Consumer Price Index (Year-over-Year)
Recent Economic Releases
| Indicator | Prior period | Current period (forecast) | Current period (actual) |
|---|---|---|---|
| Real Gross Domestic Product (Q3) | -31.4% | 33.1% | 33.4% |
| Personal Consumption Expenditures Deflator (Nov.) (YoY) | 1.2% | 1.0% | 1.1% |
| Pending Home Sales (Nov.) (MoM) | 128.9 | 126.0 | 125.7 |
Key Interest Rates
| 1/4/21 | 12/28/20 | Change | |
|---|---|---|---|
| Fed Funds | 0.25% | 0.25% | -- |
| 1-mo. Libor | 0.14% | 0.15% | -0.01 |
| 3-mo. Libor | 0.24% | 0.25% | -0.01 |
| 2-yr. UST | 0.12% | 0.13% | -0.01 |
| 5-yr. UST | 0.37% | 0.38% | -0.01 |
| 10-yr. UST | 0.93% | 0.94% | -0.01 |
| 30-yr. UST | 1.66% | 1.67% | -0.01 |
Rate Forecast - Futures Market
| Q4-20 | Q1-21 | Q2-21 | Q3-21 | |
|---|---|---|---|---|
| Fed Funds | 0.25% | 0.25% | 0.25% | 0.25% |
| 1-mo. Libor | 0.10% | 0.10% | 0.10% | 0.10% |
| 3-mo. Libor | 0.20% | 0.20% | 0.20% | 0.20% |
| 2-yr. UST | 0.20% | 0.30% | 0.30% | 0.40% |
| 5-yr. UST | 0.50% | 0.60% | 0.60% | 0.70% |
| 10-yr. UST | 1.00% | 1.10% | 1.20% | 1.30% |
| 30-yr. UST | 1.80% | 1.90% | 2.00% | 2.10% |