economy
May 3, 2021
Eyes on the Economy: Housing, Infrastructure, Jobs

Housing Rebounds in March
Housing investment bounced back in March and should remain solid through the remainder of this year thanks to low mortgage rates and improving demographics. About 12.5 percent of the U.S. population, or roughly 39 million Americans, are age 26 to 34, which suggests a noticeable uptick for demand as the average age of a first-time homebuyer is early 30s.
The National Association of Home Builders Housing Market Index remains elevated with a reading of 83, which is robust given that it’s far above the 50-point mark that indicates positive conditions. It’s clear that February’s drop was merely weather-related. Builders face some near-term challenges, including rising construction costs. However, economists don’t anticipate that this will weigh too heavily on starts this year.
Infrastructure Upgrades: Who Will Foot the Bill?
If President Joe Biden’s infrastructure plans remain on track, the U.S. economy could see a big boost this year. The spending will benefit a wide range of industries, including autos, steel, asphalt, concrete, building materials, tech and utilities. Critics of the American Jobs Plan are unhappy with the thought of unwinding Trump-era corporate tax cuts to pay for it. They worry higher commercial taxes will make America’s businesses less competitive versus overseas companies. Studies show there is little relationship between the effective corporate tax rate and changes in real business equipment spending. Most U.S. corporations have no trouble getting cheap capital, and they pay among the lowest effective tax rates in the world. U.S. corporate tax revenue as a share of gross domestic product is around 1 percent, compared with 4 percent in Canada and Japan. The bigger question may be who will decide what projects will receive funding. With recovery picking up steam, every state is going to want a piece of the pie.
Jobless Claims Fall to Pandemic Low as Economy Accelerates
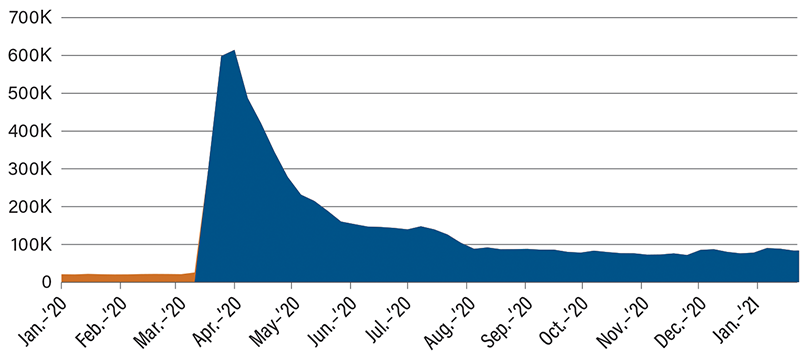
As hoped, applications for U.S. state unemployment insurance plunged to a fresh pandemic low as the job market recovery picks up steam. Initial claims in regular state programs decreased by 39,000 to 547,000 in the week ended April 17. This was the first time claims have fallen below the 600,000 threshold since March 2020—and it easily beat economists’ expectations for a tally of 610,000 claims.
The job market is strengthening as employers look to fill positions that were left empty by pandemic restrictions that are now being eased. More jobs means more spending, which drives 70 percent of the U.S. economy. Overall, the trend in claims data follows strong manufacturing, retail sales and other economic indicators as of late. With a current unemployment rate of 6.0 percent, well below the pandemic peak of nearly 15 percent, there is still plenty of ground to make up prior to hitting the low of 3.5 percent achieved in February 2020. Bloomberg economists are expecting nonfarm payrolls to climb to more than 888,000 for the month of April, which would be very close to March’s actual of 916,000. Unemployment claims should continue to fall; however, for individuals out of work, the indicator can’t fall fast enough.
Weekly Jobless Claims
Recent Economic Releases
| Indicator | Prior period | Current period (forecast) | Current period (actual) |
|---|---|---|---|
| NAHB Housing Market Index (Mar.) (MoM) | 82 | 83 | 83 |
| Jobless Claims (April 17) | 642K | 576K | 547K |
| New-Home Sales (Mar.) (MoM) | 775K | 886K | 1,021K |
Key Interest Rates
| 4/26/21 | 4/19/21 | Change | |
|---|---|---|---|
| Fed Funds | 0.25% | 0.25% | -- |
| 1-mo. Libor | 0.11% | 0.11% | -- |
| 3-mo. Libor | 0.18% | 0.19% | (0.01) |
| 2-yr. UST | 0.16% | 0.16% | -- |
| 5-yr. UST | 0.83% | 0.85% | (0.02) |
| 10-yr. UST | 1.58% | 1.61% | (0.03) |
| 30-yr. UST | 2.25% | 2.29% | (0.04) |
Rate Forecast - Futures Market
| Q2-21 | Q3-21 | Q4-21 | Q1-22 | |
|---|---|---|---|---|
| Fed Funds | 0.25% | 0.25% | 0.25% | 0.25% |
| 1-mo. Libor | 0.12% | 0.15% | 0.20% | 0.20% |
| 3-mo. Libor | 0.20% | 0.25% | 0.30% | 0.30% |
| 2-yr. UST | 0.30% | 0.30% | 0.40% | 0.40% |
| 5-yr. UST | 1.00% | 1.10% | 1.20% | 1.20% |
| 10-yr. UST | 1.78% | 1.85% | 1.95% | 1.95% |
| 30-yr. UST | 2.53% | 2.60% | 2.70% | 2.70% |