economy
September 20, 2021
Eyes on the Economy: Manufacturing, Jobs, Vehicles

Manufacturing Hangs Tough
August’s Institute for Supply Management (ISM) Manufacturing Index reading beat expectations, coming in at 59.9 and marking the 15th consecutive month of expansion. Low inventories and long lead times have stymied manufacturing and driven price growth this year, but August’s increase in the production and inventories index suggests progress is underway. While well above historical averages, the prices-paid index appears to be moving closer to a supply-and-demand equilibrium. But producers are certainly not out of the woods. Stricter approaches to mitigating COVID’s delta variant in East Asian countries mean there are still delays. Expect the spillover effects to continue to dog manufacturers here in the U.S.
Open Jobs Reach New High
Job openings again pushed higher in July, reaching a new record of 10.93 million vacancies, well above the June total of 10.18 million. Meanwhile, hiring fell slightly to 6.67 million from 6.83 million. Hence, the gap between hires and openings has widened. These results provide more confirmation of the difficulty companies across industries and the public sector are facing in filling positions.
The number of unemployed workers has fallen by half as workers stepped back into the workplace or stepped out of the labor pool entirely—either from retirement or a variety of reasons ranging from childcare challenges to fear of COVID-19. That leaves 8 million unemployed workers. Now that the enhanced unemployment benefits are no longer available and many schools have resumed in-person instruction, the pool of available workers should expand. However, cutting off enhanced benefits in a number of states over the summer did not bring an appreciable number of workers back into the labor force, so the jury is still out. Economists expect the gap between unemployed workers and job openings to slowly close as the virus begins to fade and children resume in-person instruction
Chip Shortage Continues To Jam Up Vehicle Sales
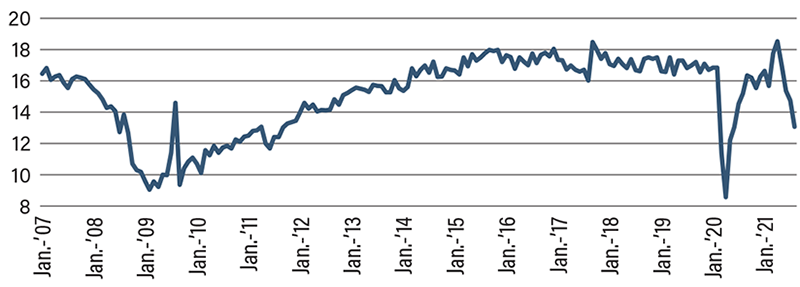
Annualized U.S. new-vehicle sales fell again in August. A global shortage of semiconductor microchips continues to put the brakes on auto production, capping the number of vehicles sold. With 13.1 million seasonally adjusted annualized units sold, new-vehicle sales significantly underperformed expectations with no near-term solution available. North American production in July was 111,000 vehicles. The average monthly production over the past 10 years has been 278,000 vehicles. July’s figure was the fourth-lowest number of vehicles produced in North America on record. The only lower-output months were the COVID-19 shutdown months of April and May 2020 and a blip during the heart of the Great Recession in January 2009.
The once highly interconnected supply chain for the auto industry has now become the industry’s Achilles’ heel. The question for new-vehicle sales now shifts to how low can they go? With inventory levels sitting 30 percent below their all-time low and one-tenth the long-run average, it leaves one wondering if August will be the low-water mark caused by the chip famine—or is the worst yet to come? The outlook on when the semiconductor shortage ends remains incredibly murky. It is expected to gradually ease in the next few months and then return to normal production levels over the next three quarters.
Vehicle Sales (in millions)
Recent Economic Releases
| Indicator | Prior period | Current period (forecast) | Current period (actual) |
|---|---|---|---|
| ISM Manufacturing (Aug.) | 59.5 | 58.5 | 59.9 |
| Vehicle Sales (Aug.) (Annualized) | 14.75 M | 14.45 M | 13.06 M |
| Change in Nonfarm Payrolls (July) (MoM) | 943 K | 733 K | 235 K |
Key Interest Rates
| 9/13/21 | 9/07/21 | Change | |
|---|---|---|---|
| Fed Funds | 0.25% | 0.25% | -- |
| 1-mo. Libor | 0.08% | 0.08% | -- |
| 3-mo. Libor | 0.12% | 0.12% | -- |
| 2-yr. UST | 0.23% | 0.22% | 0.01 |
| 5-yr. UST | 0.79% | 0.82% | (0.03) |
| 10-yr. UST | 1.30% | 1.38% | (0.08) |
| 30-yr. UST | 1.90% | 1.99% | (0.09) |
Rate Forecast - Futures Market
| Q3-21 | Q4-21 | Q1-22 | Q2-22 | |
|---|---|---|---|---|
| Fed Funds | 0.25% | 0.25% | 0.25% | 0.25% |
| 1-mo. Libor | 0.10% | 0.12% | 0.15% | 0.20% |
| 3-mo. Libor | 0.20% | 0.20% | 0.25% | 0.30% |
| 2-yr. UST | 0.25% | 0.30% | 0.35% | 0.40% |
| 5-yr. UST | 0.80% | 0.90% | 1.00% | 1.10% |
| 10-yr. UST | 1.70% | 1.80% | 1.89% | 1.96% |
| 30-yr. UST | 2.10% | 2.20% | 2.30% | 2.40% |