Eyes on the Economy: Home Prices Mixed, US GDP Growth, Disappointing Jobs Report

Home Price Indices Send Mixed Signals
The S&P CoreLogic Case-Shiller National Home Price Index declined 0.3% month-over-month in August. From a year ago, home prices were 4.2% higher in August, a slowdown from July’s annual gain of 4.8%. This may be a sign that home prices have stopped rising, as too many would-be homebuyers have been priced out of the market. The index is a composite of single-family home price indices for the nine U.S. Census divisions.
However, another home price gauge for single-family houses with mortgages guaranteed by Fannie Mae and Freddie Mac, the U.S. Home Price Index, continued to break records in August, posting a 4.2% year-over-year and 0.3% month-over-month gain. The difference in the movement of the home price indices suggests that the guaranteed mortgages have helped to maintain demand and thus keep home prices high in this market segment. It is likely that the housing market is currently at a stand-off position, where sellers are reluctant to make price cuts while many buyers are not in financial positions to afford the current prices without some assistance from government-sponsored programs.
U.S. Economy Grew 2.8% in the Third Quarter
In the third quarter of 2024, U.S. real gross domestic product (GDP) grew at annualized rate of 2.8% from the previous quarter. In this first estimate, the quarterly real GDP growth was slightly below the forecast figure of 3%, but considered a historically solid growth rate. The third quarter’s growth was largely driven by personal consumption expenditures, which grew 3.7% and contributed 2.46 percentage points to real GDP growth. Government spending grew 5% and contributed 0.85 percentage points.
Meanwhile, gross domestic investment barely grew at 0.3% and contributed only 0.07 percentage points to real GDP growth. Net exports continued to subtract from growth, taking away 0.56 percentage points. Overall, personal consumption almost single-handedly carried economic growth in the third quarter.
The Job Market Hit by Strike and Hurricanes
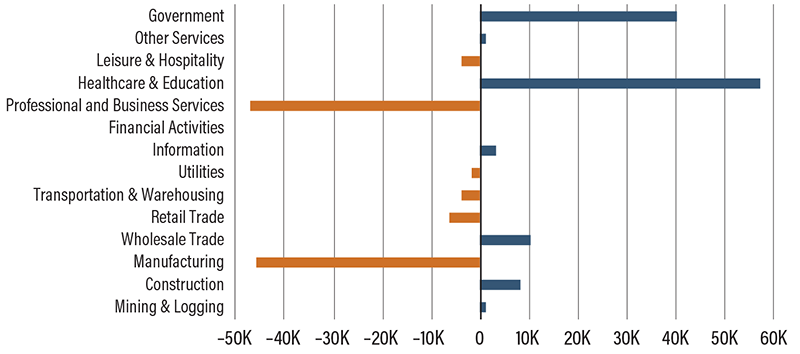
The U.S. economy added only 12,000 nonfarm jobs in October, the slowest gain since December 2020 and significantly below the forecasts of 113,000. A Boeing labor strike and multiple hurricanes resulted in substantial job losses. Nonetheless, these two factors cannot fully explain the disappointing data if one looks deeper into the breakdown of the jobs report. For the Boeing strike, the impact should be limited to the industry. Employment in manufacturing decreased 46,000, with 44,000 of those lost jobs in transportation equipment manufacturing “that was largely due to strike activity.”
As for the hurricanes, job losses should be limited to the areas directly impacted. Job losses in states not impacted by the hurricanes cannot be explained by these natural disasters. However, state-level data lags behind national data. Thus, we will only be able to see this later. Nonetheless, we can look at employment by industries. Financial activities posted no growth in October. This has been a pattern for many months before the hurricanes and cannot be attributed to the weather. Likewise, the tech industry and utilities have experienced similar slow or negative growth trends. Therefore, the job market likely slowed for economic reasons and was also hit by the strike and hurricanes.
1-month Net Change in Employment, by Industry

Source: U.S. Bureau of Labor Statistics.
Recent Economic Releases
| Indicator | Prior period | Current period (forecast) | Current period (actual) |
|---|---|---|---|
| S&P CoreLogic Case-Shiller Home Price Index (Aug)(MoM) | 0.0% | (0.1)% | (0.3%) |
| Home Price Index (Aug)(MoM) | 0.2% | 0.2% | 0.3% |
| Real GDP (Q3 24)(QoQ) | 3.0% | 3.0% | 2.8% |
| Nonfarm Payrolls (Oct) | 223K | 113K | 12K |
Key Interest Rates
| 11/4/24 | 10/28/24 | Change | |
|---|---|---|---|
| Fed Funds | 5.00% | 5.00% | --- |
| 2-yr. UST | 4.18% | 4.14% | 0.04 |
| 5-yr. UST | 4.17% | 4.11% | 0.06 |
| 10-yr. UST | 4.31% | 4.25% | 0.03 |
| 30-yr. UST | 4.50% | 4.53% | (0.03) |
Rate Forecast — Futures Market
| Q4-24 | Q1-25 | Q2-25 | Q3-25 | |
|---|---|---|---|---|
| 4.50% | 4.25% | 4.00% | 4.00% | |
| 3.75% | 3.65% | 3.45% | 3.40% | |
| 3.75% | 3.65% | 3.60% | 3.60% | |
| 3.95% | 3.90% | 3.85% | 3.80% | |
| 4.25% | 4.20% | 4.20% | 4.20% |
