economy
September 22, 2025
Eyes on the Economy: Builder Confidence, Imports, Manufacturing

Builder Confidence Holds Steady
Builder confidence in newly built single-family homes held steady at 32 in September, unchanged from August, according to the National Association of Home Builders Housing Market Index. Sentiment has hovered between 32 and 34 since May, reflecting persistent challenges from high construction costs. However, optimism is rising as mortgage rates ease, with the Federal Reserve cutting the federal funds rate by 25 basis points. The 30-year fixed mortgage average recently fell to 6.35%, the lowest since October 2024, boosting expectations for stronger housing demand later this year.
Despite this, market conditions remain soft, with 39% of builders cutting home prices in September, the highest share since the pandemic, with average reductions of 5%. Among index components, future sales expectations climbed two points to 45, the highest since March, while current sales held at 34 and buyer traffic slipped to 21. Regionally, the Midwest and West posted slight gains, while the Northeast and South were steady.
Import and Export Prices Increase
U.S. import prices rose 0.3% in August 2025, following a 0.2% increase in July, as higher nonfuel import prices offset declines in fuel costs. Fuel import prices dropped 0.8%, led by a 13.2% fall in natural gas, marking its sixth consecutive monthly decline. Over the year, fuel import prices fell 10.1%, though natural gas prices remained 43.5% higher than a year earlier. Nonfuel import prices rose 0.4%, the largest gain since April 2024, driven by consumer goods, capital goods and industrial supplies, while food-related imports declined 2.1%.
Export prices also advanced 0.3% in August, matching July’s gain, and were up 3.4% year-over-year, the strongest annual increase since 2022. Nonagricultural exports, including consumer goods, capital goods and industrial materials, drove the monthly and annual gains. Agricultural export prices were flat in August but up 5.1% from a year earlier. Regionally, import prices rose from China, Canada, Mexico, Japan and the European Union, while U.S. export prices increased sharply to Canada but fell to China.
Industrial Production Edges Up as Manufacturing Rebounds
Industrial production rose 0.1% in August following a 0.4% decline in July. Manufacturing output increased 0.2%, with motor vehicles and parts surging 2.6% and other factory output edging up 0.1%. Mining expanded 0.9% after a July drop. Utilities fell 2.0%, led by weaker electricity generation. Overall industrial production stood at 103.9% of its 2017 average, up 0.9% year-over-year. Capacity utilization held steady at 77.4%, about 2.2 percentage points below its long-run average.
Across market groups, consumer durables gained 0.6%, mainly on automotive strength, and nondurables rose 0.3%. Business equipment slipped 0.1% due to weaker industrial machinery, despite gains in transit and IT equipment. Construction supplies advanced 0.6% but business supplies dropped 0.4%. Materials output edged up 0.1%. Within industries, durable goods rose 0.2%, supported by autos but offset by declines in fabricated metals and machinery. Nondurables climbed 0.3%, with textiles and petroleum leading the gains, while plastics and rubber declined. Mining capacity utilization increased to 90.6%, well above average, but utilities fell to 68.6%, significantly below historical norms.
Capacity Utilization Running Below Historical Average
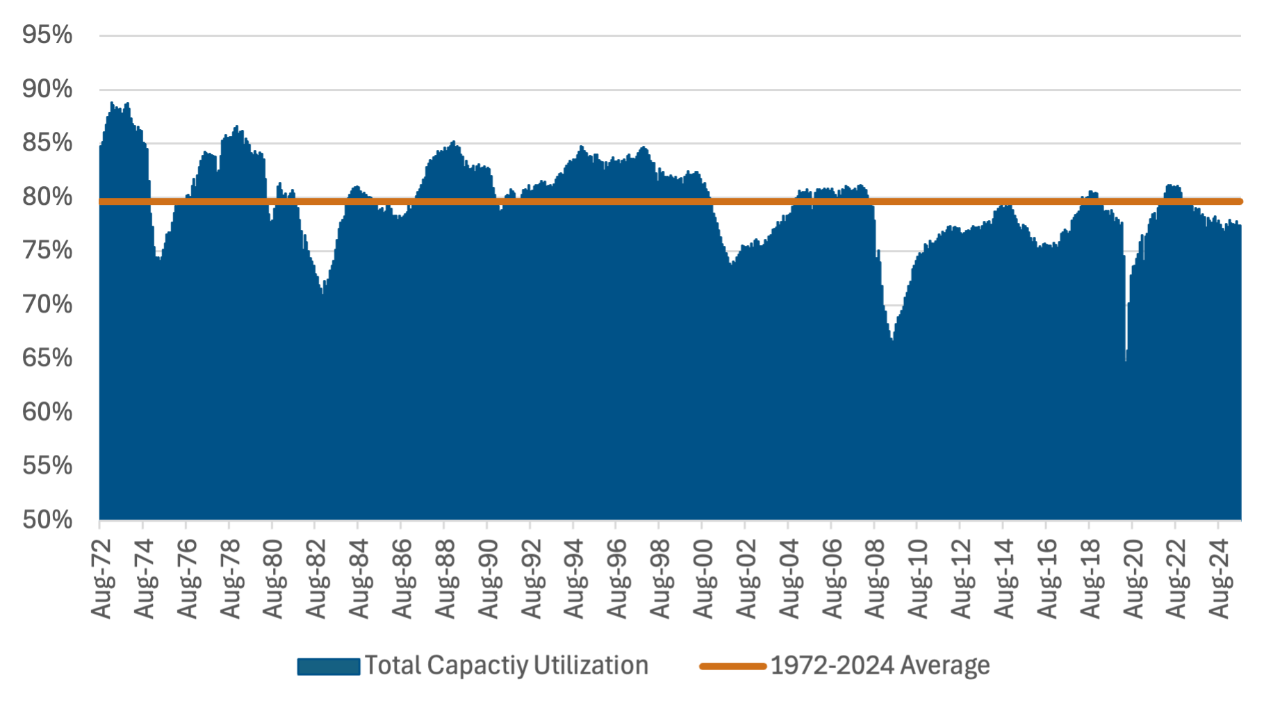
Source: Trading Economics.
Recent Economic Releases
| Indicator | Prior period | Current period (forecast) | Current period (actual) |
|---|---|---|---|
| NAHB Housing Market Index (Sep.) | 32.0 | 33.0 | 32.0 |
| Export Prices (Aug.)(MoM) | 0.3% | 0.0% | 0.3% |
| Import Prices (Aug.)(MoM) | 0.2% | (0.1%) | 0.3% |
| Industrial Production (Aug.)(MoM) | (0.4%) | (0.1%) | 0.1% |
