economy
October 30, 2023
Eyes on the Economy: Business Activity, Leading Indicators, US Deficit

Business Activity Edges Higher After Stagnation
The S&P Composite Purchasing Managers’ Index (PMI) edged slightly higher from 50.2 in September to 51 in October. A reading above 50 indicates expansion while below 50 points to contraction. The S&P Composite PMI was marginally above 50 in the last two months of the third quarter, suggesting activity stagnated.
The marginal uptick in October was driven by improvement in manufacturing, which came out of contraction to stagnation (50), and services, where activity moved from near stalling to marginal expansion (50.9). As cost burdens decelerated, manufacturers and service providers reported raising prices at a slower pace in a bid to drive sales. As consumers get closer to the edge due to the rising cost of living, it appears producers are slowly learning that hiking prices at a faster pace than cost inputs will slow sales when consumers are already close to the breaking point.
Leading Indicators Decline
The Conference Board Leading Economic Index (LEI) declined 0.7% in October, more than the consensus forecast of a 0.4% decline. This marks 18 months of consecutive monthly declines. The LEI is a composite of key leading economic indicators that provide an early indication of significant turning points in the business cycle. That is, leading indicators turn before the whole economy takes a turn. The sustained declines of the leading index suggest that an economic downturn is in sight.
Meanwhile, the Coincident Economic Index (CEI), a composite of coincident indicators, increased 0.3% in September. Coincident indicators move the same as the economy. The modest increase suggests the economy is still growing, although at a slow pace, and an economic downturn has not occurred. Overall, we are looking at an economy that is nearing a downturn but is still growing incrementally.
U.S. Deficit Increases in Fiscal Year 2023
The federal government wrapped up fiscal year (FY) 2023 with a deficit of $1.7 trillion, the largest shortfall outside of the COVID era. This marks a 23% increase from the previous fiscal year. While the numbers are concerning, they could have been even worse. Without a little accounting trick in FY 2022, this year’s deficit would have doubled last year’s. The U.S. Treasury Department calculated the FY 2022 deficit by including President Joe Biden’s student loan cancellation proposal, which never took effect. Without the student loan cancellation, the FY 2022 deficit was actually closer to $1 trillion, instead of the $1.4 trillion shown by the Treasury. The government then logged the overturning of the student loan cancellation as savings for FY 2023, bringing the deficit down to $1.7 trillion when in reality it was around $2 trillion. The total for both fiscal years would have been around $3 trillion either way, but the chosen methodology allows the official figures to hide the magnitude of the increase from FY 2022 to FY 2023. Another contributing factor to the increased deficit was a 2022 decline in revenue, largely driven by declines in stock values. Income from 2022 was recorded in tax revenue in FY 2023.
Fiscal Year Deficit 2001–2023 (in Trillions)
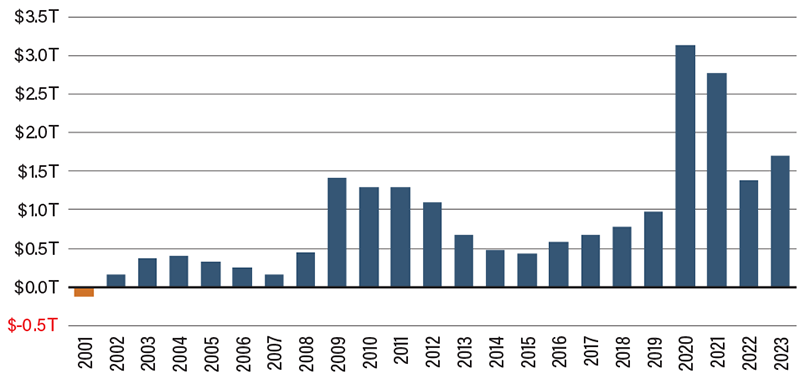
Source: U.S. Department of Treasury.
Recent Economic Releases
| Indicator | Prior period | Current period (forecast) | Current period (actual) |
|---|---|---|---|
| S&P Global US Composite PMI (Oct.) | 50.2 | 49.8 | 51.0 |
| S&P Global US Manufacturing PMI (Oct.) | 49.8 | 49.5 | 50.0 |
| Leading Economic Index (Sep.)(MoM) | (0.5%) | (0.4%) | (0.7%) |
| US Deficit (FY 2023) | $1.4T | N/A | $1.7T |
