economy
March 2, 2026
Eyes on the Economy: Consumer Confidence, Factory Orders, Home Prices

Consumer Confidence Edges Higher in February
The Conference Board Consumer Confidence Index rose 2.2 points in February to 91.2, rebounding from January’s revised 89.0 but remaining well below its recent peak in November 2024 of 112.8. The gain was driven by improved expectations, as the subindex for expectations climbed 4.8 points to 72.0, though it remains at levels historically associated with recession risk. Consumers grew less pessimistic about future business and labor market conditions and more positive about income prospects.
However, the subindex for present situation fell 1.8 points to 120.0, reflecting weaker views of current business conditions. Perceptions of job availability improved modestly. Confidence rose among consumers under 35, particularly Gen Z, but declined for older age groups and most income brackets. By political affiliation, sentiment improved among Republicans and Independents, while Democrats became less optimistic. Consumers’ written responses remained largely pessimistic, with inflation and high prices still top concerns. References to trade and politics increased in February, while mentions of labor market conditions declined slightly.
Factory Orders Slip in December
U.S. manufactured goods orders declined 0.7% in December 2025 to a seasonally adjusted $617.5 billion, easing from November’s six-month high of $621.9 billion and close to expectations for a 0.5% drop. Durable goods orders fell 1.4% to $319.9 billion, driven primarily by a 5.4% decline in transportation equipment, as nondefense aircraft and parts plunged 24.8%. Excluding that weakness, several categories posted gains, including computers and electronic products (3.1%), machinery (0.5%), fabricated metal products (0.9%) and primary metals (2.1%). Orders for nondurable goods were essentially flat for a second straight month at $297.6 billion, indicating stable underlying demand outside the volatile aircraft sector.
Home Price Inflation Slows as Affordability Constrains Demand
The S&P Cotality Case-Shiller Index showed U.S. home prices posted a 1.3% annual gain for December 2025, the weakest full-year growth since 2011 and well below the 10-year average of 5%–6%. Even excluding the pandemic surge, appreciation significantly underperformed historical norms. The 30-year mortgage rate ended 2025 at 6.2%, far above pre-2022 averages, constraining affordability and demand. Meanwhile, annual inflation of 2.7% exceeded home-price growth, a reversal from the prior decade when housing growth consistently outpaced inflation.
Performance split sharply across the year, as prices rose 2.6% in the first half but fell 1.3% in the second, with all 20 major metros declining in the second half. Midwest and Northeast cities like Chicago and New York led gains, while formerly high-flying Sun Belt markets such as Tampa, Denver and Phoenix posted the steepest drops, extending their post-pandemic correction.
Separately, the Federal Housing Finance Agency (FHFA) House Price Index reported a stronger 1.8% year-over-year gain in December 2025 and recorded positive annual appreciation in each quarter since 2022. Unlike Case-Shiller, which measures changes in total value of single-family housing stock, FHFA tracks seasonally adjusted, purchase-only mortgages backed by Fannie Mae and Freddie Mac.
Home Prices Remain Significantly Higher Than Pre-COVID Levels
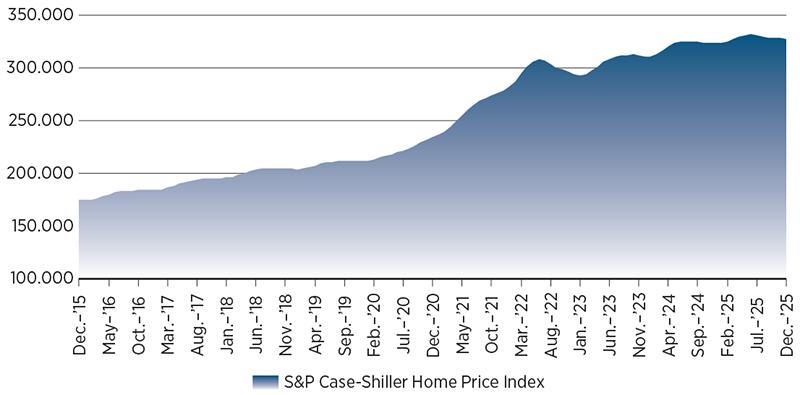
Source: Federal Reserve Bank of St. Louis.
Recent Economic Releases
| Indicator | Prior period | Current period (forecast) | Current period (actual) |
|---|---|---|---|
| Conference Board Consumer Confidence (Feb.) | 89.0 | 87.0 | 91.2 |
| Factory Orders (Dec.)(MoM) | 2.7% | (0.5%) | (0.7%) |
| S&P Cotality Case-Shiller National Home Price Index (Dec.)(YoY) | 1.4% | N/A | 1.3% |
| FHFA House Price Index (Dec.)(YoY) | 2.1% | 1.8% | 1.8% |
Key Interest Rates
| 2/23/26 | 2/17/26 | Change | |
|---|---|---|---|
| Fed Funds | 3.75% | 3.75% | --- |
| 2-yr. UST | 3.46% | 3.44% | 0.02 |
| 5-yr. UST | 3.58% | 3.62% | (0.04) |
| 10-yr. UST | 4.03% | 4.28% | (0.25) |
| 30-yr. UST | 4.70% | 4.68% | 0.02 |
Rate Forecast — Futures Market
| Q1-26 | Q2-26 | Q3-26 | Q4-26 | |
|---|---|---|---|---|
| 3.75% | 3.75% | 3.50% | 3.25% | |
| 3.48% | 3.44% | 3.42% | 3.39% | |
| 3.70% | 3.70% | 3.70% | 3.69% | |
| 4.17% | 4.17% | 4.18% | 4.18% | |
| 4.79% | 4.80% | 4.79% | 4.77% |
