economy
June 1, 2026
Eyes on the Economy: GDP, Inflation, Home Prices

Real GDP Revised Down Due to Weaker Consumption and Investment
The U.S. economy grew at an annualized rate of 1.6% in the first quarter of 2026, improving from 0.5% in the last quarter of 2025 but falling short of the 2% from the first estimate due to downward revisions in consumer spending and investment. Consumer spending increased 1.4%, slightly below the initial 1.6% estimate, driven mainly by a 1.8% rise in services demand, while goods spending remained modest at 0.4%. Gross private domestic investment climbed 7%, down from the previously reported 8.7%. Equipment investment surged 17.2% and spending on intellectual property products rose 11.6%, though investment in structures and residential housing declined 5.4% and 6.2%, respectively. Net trade weighed on growth, subtracting 1.25 percentage points from gross domestic product (GDP), as exports rose 13.1% while imports jumped 21.1%. Meanwhile, government spending increased 4.4%, rebounding from Q4’s 5.6% contraction, as activity resumed following the government shutdown.
Fed’s Preferred Inflation Gauge Hits Three-Year High
The Federal Reserve’s preferred inflation gauge, the Personal Consumption Expenditures (PCE) index, recorded its fastest increase in three years in April, fueled largely by surging energy costs linked to the Iran war. The rise in inflation reinforced expectations that the Fed will keep interest rates unchanged well into next year. Higher prices are squeezing household finances and threatening consumer spending and economic growth. Inflation-adjusted disposable income fell for a third consecutive month in April, while the personal saving rate dropped to a four-year low. Disruptions to shipping through the Strait of Hormuz have driven up energy prices, strained global supply chains and created shortages in goods ranging from fertilizer to consumer products. National average gasoline prices rose 12.3% in April and are up more than 50% since the conflict began in late February. Core PCE inflation rose 3.3% year over year, its highest level since November 2023, while monthly core inflation increased 0.2%.
US Home Price Growth Slows as Mortgage Rates Climb
U.S. home price growth continued to slow in March 2026, reflecting ongoing affordability pressures and weakening demand across many housing markets. The S&P CoreLogic Case-Shiller National Home Price Index rose 0.7% year over year in March, down from a 0.8% increase in February. More than half of major metropolitan areas recorded annual price declines, with Seattle posting the steepest drop at 2.5%, replacing Denver as the weakest market. Chicago remained the strongest major market with a 6.1% annual gain. Rising mortgage rates added further pressure on buyers, as the average 30-year fixed mortgage rate rebounded from below 6% in late February to around 6.4% by the end of March.
Separately, the Federal Housing Finance Agency (FHFA) House Price Index showed somewhat firmer trends, with U.S. house prices increasing 1.7% between the first quarter of 2025 and the first quarter of 2026 and rising 0.5% from the previous quarter. Prices increased in 42 states, led by Illinois, Alaska and Vermont, while Colorado recorded the largest decline. Regionally, the East North Central division saw the strongest appreciation, while the West South Central division experienced modest declines.
30-Year Fixed Mortgage Rate Climbing Again
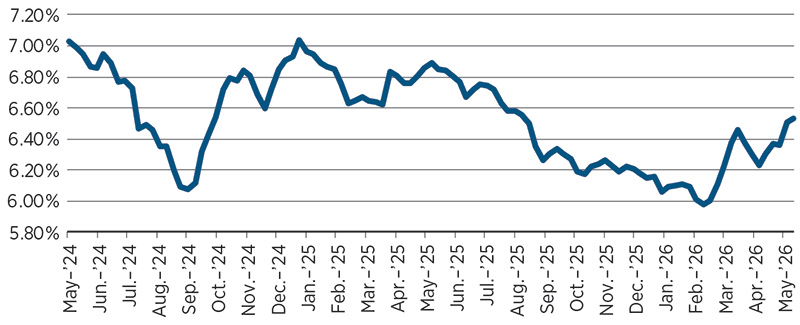
Source: Federal Reserve Bank of St. Louis.
Recent Economic Releases
| Indicator | Prior period | Current period (forecast) | Current period (actual) |
|---|---|---|---|
| Real GDP Growth Rate (Q1 26)(QoQ) | 0.5% | 2.0% | 1.6% |
| Personal Consumption Price Index (Apr.)(YoY) | 3.5% | 3.8% | 3.8% |
| S&P Cotality Case-Shiller Home Price Index (Mar.)(YoY) | 0.8% | N/A | 0.7% |
| FHFA House Price Index (Mar.)(YoY) | 1.7% | 1.8% | 1.7% |
Key Interest Rates
| 5/25/26 | 5/18/26 | Change | |
|---|---|---|---|
| Fed Funds | 3.75% | 3.75% | --- |
| 2-yr. UST | 4.12% | 4.09% | 0.03 |
| 5-yr. UST | 4.26% | 4.28% | (0.02) |
| 10-yr. UST | 4.56% | 4.62% | (0.06) |
| 30-yr. UST | 5.06% | 5.15% | (0.09) |
Rate Forecast — Futures Market
| 2Q26 | 3Q26 | 4Q26 | 1Q27 | |
|---|---|---|---|---|
| 3.75% | 3.75% | 3.75% | 3.75% | |
| 3.70% | 3.64% | 3.60% | 3.57% | |
| 3.89% | 3.85% | 3.83% | 3.82% | |
| 4.31% | 4.28% | 4.26% | 4.24% | |
| 4.89% | 4.86% | 4.82% | 4.80% |
