economy
May 4, 2026
Eyes on the Economy: Retail, Manufacturing, Home Prices

Retail Sales Jump on Gas Price Spike
U.S. retail sales rose 1.7% in March, the fastest monthly increase in over three years, largely driven by a sharp rise in gasoline prices linked to the ongoing Iran war. Spending at gas stations jumped 15.5%, accounting for a significant portion of the increase. However, underlying consumer demand remained solid: Excluding gasoline, retail sales still rose a healthy 0.6%, supported by tax refunds and favorable weather.
Beyond fuel, spending was broadly positive across categories. Department store sales climbed 4.2%, while furniture and home furnishings rose 2.2%. Online retail sales increased 1.0%, and electronics and appliance stores posted a 0.9% gain. Miscellaneous retailers were the only category to decline. Restaurant spending—a proxy for services—rose just 0.1%, suggesting more modest growth in that segment. Overall, the data indicate solid consumer spending, though headline growth was significantly boosted by higher energy costs rather than a broad-based surge in discretionary demand.
Industrial Production Falls in March
U.S. industrial production fell 0.5% in March, reflecting broad-based weakness across sectors. Despite the monthly drop, output still grew at a 2.4% annualized rate in the first quarter. Manufacturing dipped 0.1% in March but maintained a stronger 3.0% quarterly pace. Mining (1.2%) and utilities (2.3%) led the decline, while overall production remained just 0.7% above year-ago levels. Capacity utilization fell to 75.7%, well below its long-run average.
Most major market groups weakened. Consumer goods output fell sharply, with durable goods down 1.8%, driven by a 2.8% drop in autos, and nondurables down 0.8%, led by lower energy production. Business equipment edged down 0.3% and materials declined 0.6%. Within manufacturing, durable goods fell 0.2%, reflecting a 3.7% drop in motor vehicles alongside declines in metals and machinery, while nondurables were broadly weaker. Overall, the March data point to slowing industrial momentum, with widespread declines and underutilized capacity despite still positive first-quarter growth.
US Home Prices Near Stagnation
Two U.S. home price indices point to a slowing, increasingly fragmented housing market. The S&P Cotality Case-Shiller index shows national prices rising just 0.7% year over year in February, while the Federal Housing Finance Agency (FHFA) index reports a somewhat stronger 1.7% gain. Despite this difference, both indices indicate weak momentum: Prices were essentially flat month over month, with only minimal seasonally adjusted increases.
More than half of major metros posted annual declines in the Case-Shiller index, with Denver (2.2%) and Seattle (2.0%) experiencing some of the largest declines. FHFA data tell a similar story, with the Mountain region ranking as the weakest division, with both monthly (1.1%) and annual (0.7%) declines. In contrast, strength remains concentrated in the Midwest and Northeast, with Chicago (5.0%), New York (4.7%) and Cleveland (4.2%) leading gains, consistent with FHFA’s Middle Atlantic outperformance.
Together, the indices suggest housing trends have become highly localized, with wide dispersion between top- and bottom-performing markets. At the same time, affordability constraints continue to weigh on demand, as existing homeowners remain locked into low mortgage rates while prospective new buyers face rates around 6%. This imbalance is limiting activity. Overall, the housing market is stagnating nationally while diverging sharply at the regional level.
Home Price Changes Nationwide and Top Cities
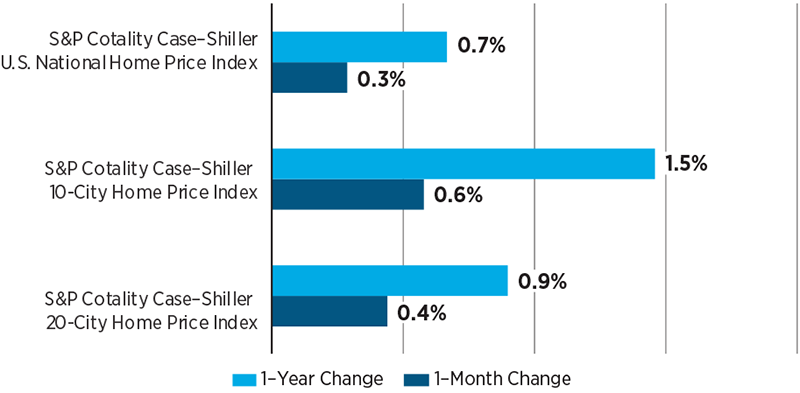
Sources: S&P Global.
Recent Economic Releases
| Indicator | Prior period | Current period (forecast) | Current period (actual) |
|---|---|---|---|
| Retail Sales (Mar.)(MoM) | 0.7% | 1.4% | 1.7% |
| Industrial Production (Mar.)(MoM) | 0.7% | 0.1% | (0.5%) |
| S&P Cotality Case-Shiller Home Price Index (Feb.)(YoY) | 0.8% | N/A | 0.7% |
| FHFA House Price Index (Feb.)(YoY) | 1.8% | N/A | 1.7% |
