economy
April 20, 2026
Eyes on the Economy: Energy Prices, Inflation, Home Sales

Inflation Climbs in March as Energy Prices Surge
The Consumer Price Index rose to 3.3% year over year in March 2026, the highest level since May 2024 and up sharply from 2.4% in the prior two months. The increase was largely driven by surging energy prices, which climbed 12.5%, including sharp gains in gasoline (18.9%) and fuel oil (44.2%) amid geopolitical tensions tied to the war with Iran. On a monthly basis, consumer prices jumped 0.9%, the fastest pace since June 2022, fueled by a 21.2% spike in gas prices.
Other categories showed more stability or even easing. Food inflation slowed to 2.7%, while shelter held steady at 3%. Used car and truck prices continued to decline. Core inflation, which excludes food and energy, edged up to 2.6% annually and 0.2% month over month. Services inflation remained elevated, particularly in transportation and medical care, while goods prices were mixed. Overall, the data point to energy-driven inflation pressures with underlying price trends remaining relatively contained.
Wholesale Inflation Hits Three-Year High but Below Expectations
The Producer Price Index (PPI) rose 4% year over year in March, marking its largest increase in three years. However, the data came in below expectations, as economists had projected a sharper rise to 4.6% annually and a 1.1% monthly jump due to energy shocks. Instead, wholesale inflation was moderated by declining food prices and flat services costs, which helped offset surging oil prices. On a monthly basis, the PPI increased 0.5%, the same rate as in February, with an 8.5% spike in energy prices driving much of the gain. Core PPI, which excludes food and energy, rose just 0.1% month over month, keeping the annual core rate steady at 3.8%. The timing of the data collection—captured around March 10, shortly after escalating conflict in Iran—may have also limited the full impact of rising energy costs from showing in the PPI. Overall, while inflation pressures remain elevated, the report suggests they are not accelerating as quickly as feared.
Existing-Home Sales Dip While Affordability Slips in March
Existing-home sales declined 3.6% in March to a seasonally adjusted annual rate of 3.98 million, marking a 1% drop from a year earlier, according to the National Association of Realtors (NAR). Activity weakened across all regions month over month, reflecting sluggish demand due to lower consumer confidence and softer job growth.
Inventory remained a key constraint. Total housing supply rose modestly to 1.36 million units, still well below historical norms. Estimates suggest that an additional 300,000 to 500,000 homes are needed to restore balance. Limited inventory continued to push prices higher, with the median existing-home price reaching a record $408,800 for March, up 1.4% year over year and extending a 33-month streak of annual gains. This appreciation has contributed to significant homeowner wealth accumulation in recent years.
Affordability slipped slightly from the previous month but improved compared to last year across all regions. Looking ahead, NAR revised its 2026 outlook downward due to rising mortgage rates, now expecting existing-home sales to grow 4% and new-home sales to remain flat, while home prices are still projected to rise 4%.
Existing-Home Sales Have Remained Low Since 2022
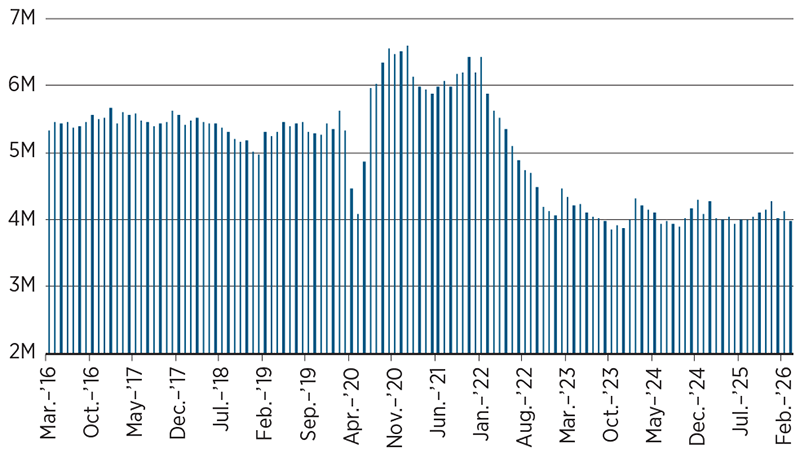
Source: Trading Economics.
Recent Economic Releases
| Indicator | Prior period | Current period (forecast) | Current period (actual) |
|---|---|---|---|
| Consumer Price Index (Mar.)(YoY) | 2.4% | 3.3% | 3.3% |
| Core Consumer Price Index (Mar.)(YoY) | 2.5% | 2.7% | 2.6% |
| Producer Price Index (Mar.)(YoY) | 3.4% | 4.6% | 4.0% |
| Existing-Home Sales (Mar.) | 4.13M | 4.06M | 3.98M |
