economy
April 10, 2023
Eyes on the Economy: Consumer Confidence, Housing Prices, Manufacturing

Consumer Confidence Index Increases
The Conference Board reported that its Consumer Confidence Index slightly improved to 104.2 in March, up from 103.4 in February. The improvement was driven by an uptick in consumer expectations, which rose from 70.4 to 73 in March. Nonetheless, it has been below 80—the level that signals a recession within a year—for 12 of the past 13 months. While expectations improved, consumers’ assessment of the current overall conditions worsened. The percentage of consumers saying current business conditions were “bad” increased from the previous month. The share of those saying jobs were “plentiful” decreased.
It is also worth noting that consumers plan to spend less on highly discretionary categories such as entertainment and dining, according the report. Meanwhile, they reportedly plan to increase spending on essentials such as health care and home maintenance.
House Prices Decelerate
As rising interest rates deter some home buyers, the housing market has cooled significantly, with house prices decelerating but remaining high. Although the S&P CoreLogic Case-Shiller home price index declined 0.6% month-over-month in January, it was still 2.5% higher than a year ago. The index has been dropping monthly since July 2022, with January’s yearly advance posting the smallest increment since November 2019.
The Federal Housing Finance Agency House Price Index, which measures the average price of single-family homes with mortgages guaranteed by Fannie Mae and Freddie Mac, advanced 0.2% in January from the previous month. From a year ago, the index increased 5.3%, the smallest jump since May 2020. Overall, there’s clear indication that home prices are cooling but still elevated. Despite expected declines, we are unlikely to see a 2008-style crash in the housing market.
Manufacturing Continues To Contract While Services Expand
The S&P Manufacturing Purchasing Managers’ Index (PMI) increased to 49.1 in March from 47.3 in February. Although the index rose, a reading below 50 still indicates a contraction. The improvement was driven by a rise in output, which was reportedly associated with the easing of supply chains, particularly of raw materials, rather than rising demand. Overall, we continue to see declines in demand as reflected in a drop in new orders while improved supply allowed firms to process backlogs and increase output.
In the services sector, however, it is the opposite story. The Services PMI jumped to 53.8 in March. The expansion drove the fastest rise in output since April 2022. The overall reading indicates strong demand as new orders increased for the first time since September 2022. The expansion, however, comes with bad news as average prices charged for services accelerated for a second consecutive month, indicating inflationary pressure in services mostly linked to upward wage pressure. Overall, the readings suggest that, while inflation is cooling in manufacturing, it is sticky—if not accelerating—in services.
Manufacturing vs. Services Purchasing Managers’ Index
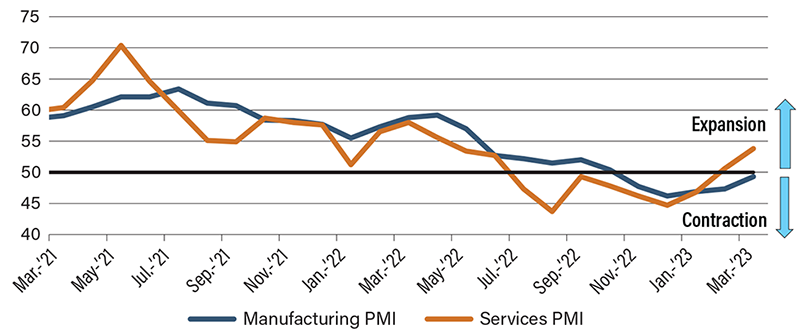
Source: Trading Economics.
Recent Economic Releases
| Indicator | Prior period | Current period (forecast) | Current period (actual) |
|---|---|---|---|
| U.S. Consumer Confidence (Mar.) | 103.4 | 101.0 | 104.2 |
| S&P Case-Shiller Home Price Index (Jan.)(YoY) | 4.6% | 2.5% | 2.5% |
| S&P Manufacturing PMI (Mar.) | 47.3 | 47.0 | 49.1 |
| S&P Services PMI (Mar.) | 50.6 | 50.5 | 53.8 |
