economy
April 24, 2023
Eyes on the Economy: Consumer Sentiment, Retail Sales, Industrial Production
Consumer Sentiment Improves
The University of Michigan Consumer Sentiment Index unexpectedly increased to 63.5 in April from 62 in March. The improvement was seen in consumers’ assessment of current conditions as well as expectations for future conditions, both beating market forecasts. Consumer sentiment is a leading indicator, and it’s one of the few that is not falling.
On the downside, consumer year-ahead inflation expectations increased to a five-month high of 4.6% in April, up from March’s 3.6%. This subindex has been fluctuating for months, reflecting the uncertainty over changes in price levels in the short run. Meanwhile, five-year inflation expectations have been steady at 2.9% the last five months, suggesting consumers see certainty in the long run. The figure is still above the Federal Reserve’s target rate of 2%, which means consumers are not convinced inflation will fall back to the target rate, even 60 months down the road.
Retail Sales Decline in March
U.S. consumers continued to cut retail spending for a second consecutive month as month-over-month retail sales fell at a seasonally adjusted rate of 1% in March—significantly more than forecasts of a 0.4% decline. The biggest drops were in sales at gasoline stations, down 5.5%, driven by lower gasoline prices, and general merchandise stores, down 3%. With elevated prices and rising interest rates, consumers also pulled back on big-ticket purchases such as vehicles, furniture and appliances.
Declining retail sales—if the trend sustains—indicates interest rate hikes are beginning to work as intended. Monetary tightening is how a central bank suppress economic growth—when it believes the growth unsustainably fuels inflation—through interest rate hikes to curb demand and ultimately slow price growth. Note that retail sales is a leading indicator, meaning that a sustained downward trend predicts an upcoming economic downturn.
Industrial Production Turns in Mixed Results
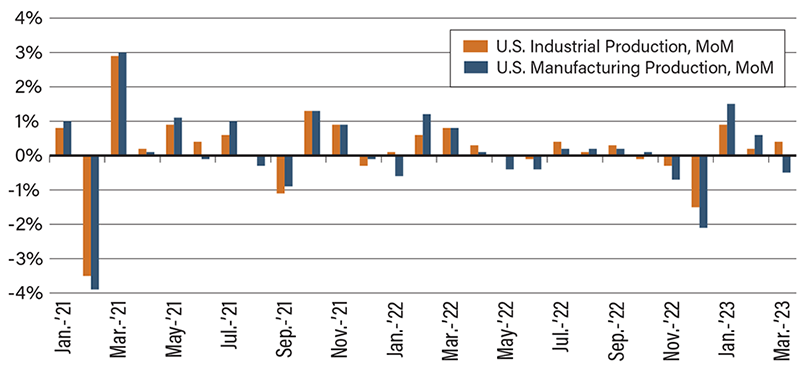
Overall, industrial production edged up 0.4% on a month-over-month basis in March, slightly more than the previous month’s increase of 0.2% and beating market expectations of 0.2%. On a yearly basis, industrial production grew 0.5%, representing a deceleration from February’s annual growth of 0.9%. These figures suggest there has not been a sustained trend in this indicator yet.
Diving deeper, however, there’s a more compelling story. Although overall industrial production increased in the last three months—after declines in the preceding three months—manufacturing output, which is the largest component of industrial production, declined 0.5% from the previous month and was 1.1% below its level a year ago. The only major industry that saw an increase in output is utilities, which posted a monthly jump of 8.4% after declines in the previous two months—thanks to the return to more seasonal weather.
Industrial production is a coincident indicator—meaning it moves simultaneously (“coincidently”) with general economic conditions; therefore, its movement reflects current economic conditions. The lack of a sustained trend in industrial production tells us today’s state of the economy is marked with uncertainty. Together with leading indicators—nearly all of which have been declining for months—the movement of industrial production signals a message. It looks like we are not yet in a recession, but one is on the way.
Manufacturing vs. Services Purchasing Managers’ Index
Source: Trading Economics.
Recent Economic Releases
| Indicator | Prior period | Current period (forecast) | Current period (actual) |
|---|---|---|---|
| University of Michigan Consumer Sentiment (Apr.) | 62.0 | 62.0 | 63.5 |
| Retail Sales (Mar.)(MoM) | -0.2% | -0.4% | -1.0% |
| Industrial Production (Mar.)(MoM) | 0.2% | 0.2% | 0.4% |
| Manufacturing Production (Mar.)(MoM) | 0.6% | -0.1% | -0.5% |
