economy
June 26, 2023
Eyes on the Economy: Consumer Sentiment, Unemployment, Housing

Consumers Feel Better
The University of Michigan Consumer Sentiment Index increased to 63.9 in June from 59.2 in the previous month, according to preliminary results. This represents a monthly increase of 8% and an increase of nearly 28% from its all-time low a year ago. However, the index is still far below its pre-pandemic February 2020 level of 101.
The June improvement reflected easing inflation and the debt ceiling agreement. Year-ahead inflation expectations decreased to 3.3% from 4.2% while long-term inflation expectations remained at 3%. This suggests consumers see progress in fighting inflation in near terms, but they expect long-term inflation to be sticky. Overall, there were improvements in current economic conditions (68 vs. 64.9) and consumer expectations (61.3 vs. 55.4). Nonetheless, these figures are low compared with historical standards.
Jobless Claims Are Rising
The number of Americans filing for unemployment insurance for the week ending June 10 was 262,000—higher than market forecasts of 249,000. The four-week average ending June 10 was 246,750—well above its pre-pandemic levels. Weekly initial unemployment insurance claims have been consistently higher than pre-pandemic levels since March 2023.
The number of initial jobless claims is a leading economic indicator regarded as moving before a turn in the business cycle. An upward trend typically signals an economic downturn ahead. While most other leading economic indicators have been signaling a recession since the second half of 2022, the number of initial jobless claims only began signaling in the last few months. Although it appears contradictory to the more resilient data in the nonfarm payrolls report, the number of initial jobless claims is forward-looking whereas the monthly nonfarm jobs number is coincident and the unemployment rate is lagging in the business cycle. Thus, it shouldn’t come as a surprise that initial jobless claims signal a downturn before other employment indicators.
Good News: Housing Market Isn’t Crashing
As we predicted in 2022, the housing market has seen some declines, but it is not crashing in the 2008 fashion. New residential construction increased 21.7% in May from a month ago to a seasonally adjusted annualized rate of 1.63 million. The figure beats market forecasts of 1.4 million and marks the highest level since April 2022. Meanwhile, building permits jumped 5.2% to 1.49 million—also beating market forecasts of 1.42 million and reflecting the highest level since October 2022. The significant increases after two consecutive months of declines suggest the supply side is stabilizing after being hit by rising interest rates and high costs.
Similarly, the National Association of Home Builders (NAHB) Housing Market Index rose for six straight months to 55 in June. Despite the sustained upward trend, the index remains below the pandemic peak and pre-pandemic levels. The improvement in builders’ confidence was driven by solid demand and supply chain recovery. Although they have declined from their peak level, home prices remain elevated and far above pre-pandemic levels. Despite higher mortgage rates and some pullback from the demand side, there is still a large portion of the current population searching for a new home. Demand is likely to remain elevated despite declining affordability.
Housing Starts Remain Strong Compared with 2008 Crash
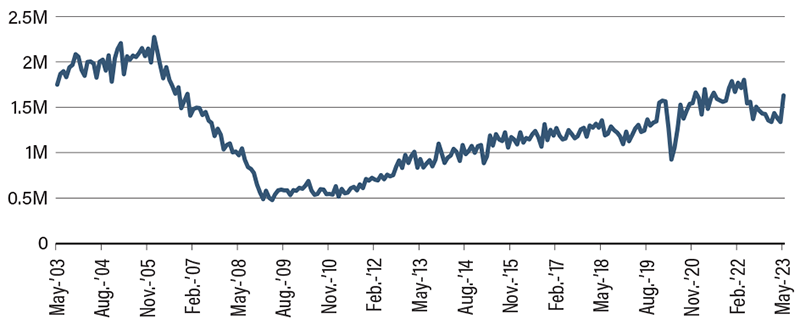
Source: U.S. Census Bureau.
Recent Economic Releases
| Indicator | Prior period | Current period (forecast) | Current period (actual) |
|---|---|---|---|
| University of Michigan Consumer Sentiment Index (Jun.) | 59.2 | 60 | 63.9 |
| 4-Week Average Jobless Claims (Jun. 10) | 237.50K | 233.38K | 246.75K |
| Housing Starts (May) | 1.34M | 1.40M | 1.63M |
| NAHB Housing Market Index (Jun.) | 50 | 51 | 55 |
