economy
July 18, 2022
Eyes on the Economy: Credit, Business Activity, Jobs

Spending on Credit Slows
As inflation eats into their income, consumers have turned to credit cards to cover expenses. In the first four months of 2022, revolving credit (such as credit card debt) was rising at annual double-digit rates. Many viewed this as resiliency in consumers who were willing to continue spending despite high prices. Things are about to change. The latest data show that revolving credit has slowed significantly, increasing 8.1 percent in May, which is down from 19.8 percent in April. This reflects the slowdown in May’s consumer spending gain.
Overall, growth in consumer credit—including revolving and non-revolving debt—decelerated considerably to $22.35 billion, the smallest gain since January and well below the forecast figure of $31.9 billion. Growth in non-revolving credit, such as auto loans and student loans, also slowed. Evidently, U.S. consumers are getting ready to hit the brakes on consumption, which we’ll likely see reflected in the second-quarter real gross domestic product growth.
Business Activity Expansion Trends Down
June 2022 was a month of continued deceleration. The S&P global U.S. Composite Purchasing Managers Index, which tracks business trends across the manufacturing and service sectors, declined to 52.3 from May’s reading of 53.6. Although a reading above 50 indicates expansion, the index has been declining since March, and June’s reading was the lowest since January. This signals a decelerating trend of business expansion in the second quarter.
Both manufacturing and services saw a broad-based slowdown. The key findings in the latest release include renewed contraction in new business, slower rise in activity with declining business confidence and sharp increases in input costs—overall painting an image of an economy where inflation begins to hurt growth.With the average mortgage rates topping 6 percent and high inflationary pressure on building material costs, housing starts declined 14.4 percent from April to 1.549 million units in May, the lowest count in 13 months. Building permits declined 7 percent over the same period to 1.695 million. This is the second consecutive month of decline. Both are leading indicators on the supply side, suggesting how many new homes will be available in the market.
Job Market Continues To Beat Expectations
All is not gloomy with the economy as the job market continued to beat expectations. Consistent with trends in the economic indicators described earlier, gains in nonfarm payrolls have slowed but are still expanding. The U.S. economy added 372,000 jobs in June, once again growing well above expectations. Although the figure indicates deceleration in the labor market, the unemployment rate has held steady at a near-historic-low 3.6 percent for four months with no signs of significant jumps. Overall, this still points to a tight labor market.
The implication of the employment figures is a mixed story. On the one hand, it is good news for workers as demand remains high despite uncertainty and recession fears. On the other hand, a tight labor market could hurt productivity and add inflationary pressure on production costs, leading to higher prices. This ultimately makes inflation more challenging to combat. The strong employment figures also pave the way for the Federal Reserve to continue with its rate hikes.
Historically, Unemployment Rates Rise with Recessions
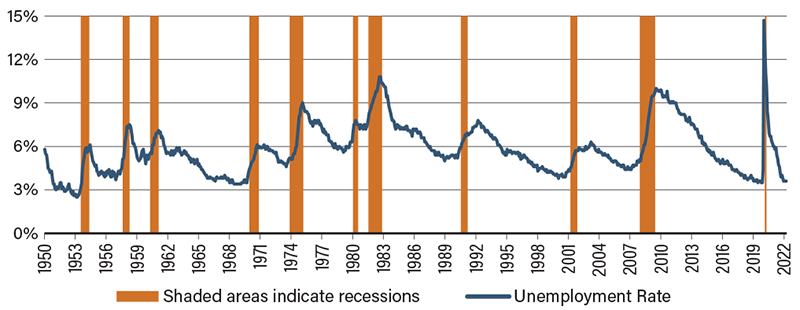
Sources: U.S. Bureau of Labor Statistics
Recent Economic Releases
| Indicator | Prior period | Current period (forecast) | Current period (actual) |
|---|---|---|---|
| Consumer Credit (May)(MoM) | $36.76B | $31.90B | $22.35B |
| S&P Global U.S. Composite PMI (June) | 53.6 | 51.2 | 52.3 |
| Nonfarm Payrolls (June)(MoM) | 384K | 300K | 372K |
| Unemployment Rate (June) | 3.6% | 3.6% | 3.6% |
