Eyes on the Economy: Durable Goods, Confidence, Home Prices

Durable Goods Orders Plunge in April
New orders for manufactured durable goods dropped 6.3% in April month-over-month—the steepest decline since January 2024, though slightly better than the expected 7.8% decrease. The drop partially offset March’s revised 7.6% increase, as the introduction of a blanket 10% reciprocal tariff and a slowdown in demand—tariff fears led to earlier front-loaded purchases—weighed on activity. Transportation equipment orders plunged 17.1%, led by a sharp 51.5% fall in nondefense aircraft and parts. Airlines paused purchases amid tariff uncertainty, with Boeing receiving just eight orders. Capital goods orders also tumbled, down 14.6%.
Confidence Rebounds in May
The Conference Board Consumer Confidence Index rose sharply in May, climbing 12.3 points to 98.0 from 85.7 in April, as consumers reacted positively to the May 12 announcement of a pause on select tariffs on Chinese imports. The Present Situation Index, which reflects consumers’ views on current business and labor market conditions, increased 4.8 points to 135.9. Meanwhile, the Expectations Index—measuring consumers’ short-term outlook for income, business and employment—jumped 17.4 points to 72.8. Despite the gain, it remained below the critical 80 mark, which often signals looming recession risks.
Confidence improved broadly across all age and income groups—and across the political spectrum—with the largest gains seen among Republicans. However, on a six-month moving average basis, sentiment remains lower due to previous declines. Consumers continued to voice concerns about the inflationary impact of tariffs and their potential drag on the economy, though some expressed optimism that recent and future trade deals could provide support. While inflation and high prices were still top concerns in May, some consumers noted signs of easing inflation and lower gas prices.
Prices Cool; Homebuyers Turn to New Construction
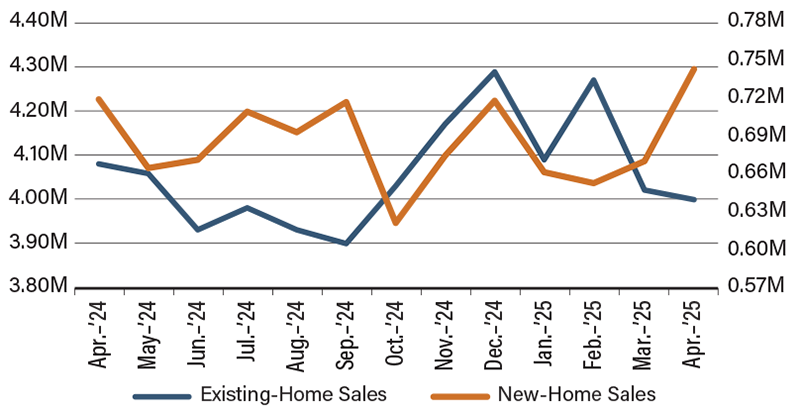
Existing-home sales edged down 0.5% month-over-month in April, following a sharp decline of 5.9% in March. This continued weakness reflects ongoing affordability challenges and limited inventory in the resale market as existing homeowners who locked in low mortgage rates are less likely to put their homes on the market. In contrast, new-home sales surged 10.9%, the strongest growth in over a year, suggesting homebuyers may be turning to new construction amid tight supply in the resale market.
Meanwhile, price growth showed signs of modest cooling. The S&P CoreLogic Case-Shiller National Home Price Index rose 3.4% year-over-year in March, down from February’s 4% annual gain. Similarly, the House Price Index for homes with mortgages backed by Fannie Mae and Freddie Mac increased 3.7% in March, easing from 3.9% growth in February. These softer price increases suggest that constrained purchasing power is weighing on demand. Overall, although new construction is gaining momentum, the broader housing market remains under pressure. Affordability remains an obstacle while new uncertainty for some buyer segments—for example, those in areas affected by the federal layoffs—has emerged.
Existing-Home Sales vs. New-Home Sales

Source: Trading Economics.
Recent Economic Releases
| Indicator | Prior period | Current period (forecast) | Current period (actual) |
|---|---|---|---|
| Durable Goods Orders (Apr.)(MoM) | 7.6% | (7.8%) | (6.3%) |
| Conference Board Consumer Confidence (May) | 85.7 | 87.0 | 98.0 |
| Existing-Home Sales (Apr.)(MoM) | (5.9%) | 2.0% | (0.5%) |
| New-Home Sales (Apr.)(MoM) | 2.6% | 3.3% | 10.9% |
Key Interest Rates
| 5/27/25 | 5/19/25 | Change | |
|---|---|---|---|
| Fed Funds | 4.50% | 4.50% | --- |
| 2-yr. UST | 3.96% | 3.98% | (0.02) |
| 5-yr. UST | 4.02% | 4.08% | (0.06) |
| 10-yr. UST | 4.43% | 4.48% | (0.05) |
| 30-yr. UST | 4.94% | 4.94% | --- |
Rate Forecast — Futures Market
| Q2-25 | Q3-25 | Q4-25 | Q1-26 | |
|---|---|---|---|---|
| 4.50% | 4.25% | 4.00% | 3.75% | |
| 3.75% | 3.60% | 3.50% | 3.45% | |
| 3.85% | 3.80% | 3.75% | 3.70% | |
| 4.20% | 4.15% | 4.10% | 4.10% | |
| 4.55% | 4.50% | 4.45% | 4.40% |
