economy
October 18, 2021
Eyes on the Economy: Durable Goods, Manufacturing, Payroll

Durable Goods Hold Steady; Chip Shortage Continues
U.S. durable goods orders were up 1.8 percent in August following a revised 0.5 percent rise (previously -0.1 percent) in July. The August gain was well above the market consensus for a 0.7 percent increase. The key core capital goods orders and shipments suggest growth in business equipment spending is moderating. This isn’t surprising as the strong growth over the past several quarters wasn’t sustainable.
Orders have been volatile recently, partly caused by big swings in motor vehicle and parts orders that are being affected by the global semiconductor shortage. Odds say the chip famine won’t be resolved until the end of next year, at best. A faster-than-expected resolution would lift production and sales of autos, information technology and other equipment.
Manufacturing Is Up, Though Outlook Down
The Institute for Supply Management Manufacturing Index unexpectedly increased in September but mostly for the wrong reason. The index rose from 59.9 in August to 61.1 in September, but the gain is attributed to an increase in supplier deliveries, which reflects slower delivery times.
The global supply chain problems are weighing on U.S. manufacturing and could limit the amount of the inventory build that is needed. Other manufacturing details were generally weaker than in August. There are other signs that the supply chain issues extend beyond long delivery times.
The September manufacturing survey showed that average commitment lead time for capital expenditures rose by eight days to 154 days. Average lead time for production materials increased by one day to 92 days, the longest cycle since the inception of the data in 1987.
Payrolls Disappoint Market, Raise More Concerns
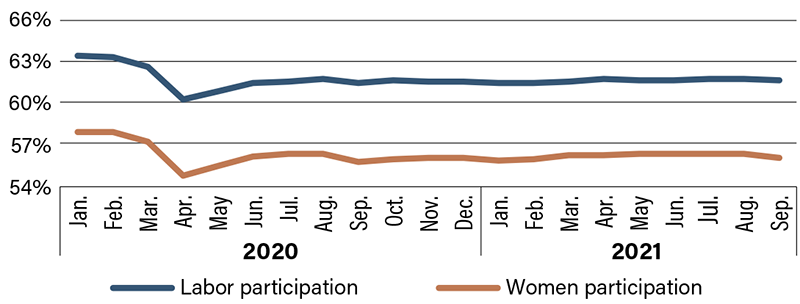
The September employment report was well below market expectations. Nonfarm payrolls increased by 194,000, which was less than half what the market anticipated. While payroll employment is up by 17.4 million jobs since April 2020, it remains 5 million jobs below its pre-pandemic peak. The state of the labor market remains unprecedented in many ways. Early in the pandemic, layoffs were the headline, but more recently the focus has shifted in favor of workers as job openings and quits have surged to record-high levels. Hiring for small businesses has been particularly difficult. The decline of the U.S. labor force participation rate last month was driven by women leaving the job market. The percentage of female workers over 20 who were employed or looking for work dropped to the lowest number since February 2021, according to data from the U.S. Labor Department. Most economists believe all the jobs lost during the pandemic will be recovered by the second half of 2022 and the labor market will return to full employment. The unemployment rate will drop to 4.5 percent by year-end 2021. However, this improvement is a bit misleading given the hole that remains in labor force participation. Expect the challenges to linger as baby boomers retire and workers seek new careers post-pandemic.
U.S. Labor Force Participation Rate
Recent Economic Releases
| Indicator | Prior period | Current period (forecast) | Current period (actual) |
|---|---|---|---|
| ISM Manufacturing Index (Sept.) | 59.9 | 59.5 | 61.1 |
| Durable Goods Orders (Aug.) (MoM) | 0.5% | 0.7% | 1.8% |
| Nonfarm Payrolls (Sept.) (MoM) | 235,000 | 500,000 | 194,000 |