economy
October 2, 2023
Eyes on the Economy: Economic Activity, PMI, Home Prices

Economic Activity Falls Below Historical Trend
The Chicago Federal Reserve National Activity Index (CFNAI) declined to minus 0.16 in August from July’s downwardly revised figure of 0.07. The index is a measure of overall U.S. economic activity, using a weighted average of 85 indicators of national economic activity. A reading of zero means the economy is expanding at its historical trend, while a negative posting indicates below-trend growth.
The CFNAI was negative in all but three months this year. Of the 85 indicators used, 50 contributed negatively to the index while 35 had positive impacts. The negative contributions broadly came from production-related indicators, sales and orders, employment and personal consumption. The three-month moving average of the index edged up from minus 0.15 to minus 0.14. Overall, the index suggests we’re looking at a general deceleration of economic activity.
S&P Composite Stagnates
The S&P Composite U.S. Purchasing Managers’ Index (PMI) edged down to 50.1 in September from 50.2 in August. The index measures monthly output and business activity in manufacturing and services. A reading above 50 indicates expansion while a reading below 50 points to contraction. Thus, September’s reading suggests stagnation across sectors where output and activity barely grew.
Manufacturing PMI remained in contraction, edging up to 48.9 from 47.9 in the previous month. Also troublesome is the loss of momentum in the service sector, where PMI continued its downward trend. If it continues, it’s an indication that the service sector—which has been the pillar of U.S. economic resilience—may be crossing into contraction territory in the coming months. This could spell a challenging winter for the economy.
Home Prices Hit Record High on Multiple Fronts
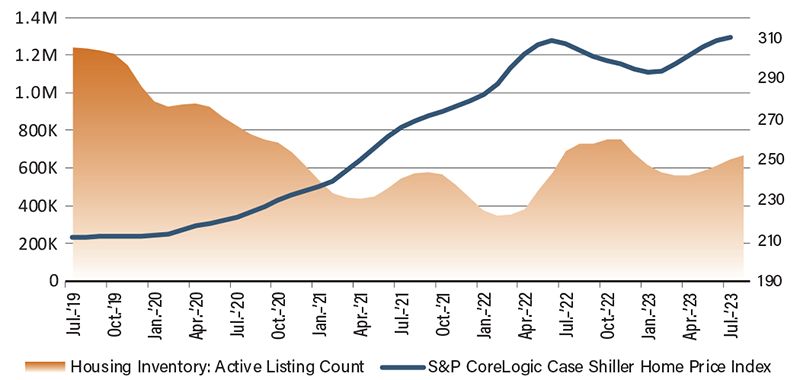
Two indices suggest that home prices not only remain elevated but also surpassed last year’s record-breaking level. First, the S&P CoreLogic Case Shiller U.S. National Home Price Index, which measures residential house prices, set a new record in July, increasing 0.98% from a year ago when home prices were near their peak. Chicago, Cleveland and New York topped the list, posting the highest year-over-year gains of all the 20 major cities.
The Federal Housing Finance Agency House Price Index, a gauge for average prices of single-family houses with mortgages guaranteed by Fannie Mae and Freddie Mac, shows a similar trend. The index posted a year-over-year increase of 4.6% in July. Overall, both indices suggest sustained growth over a period of six months after modest declines in late 2022 and early 2023.
The housing market is at its most unaffordable level in nearly 40 years. Rising mortgage rates are not compensated by declining prices, leading monthly payments to be substantially higher. As a result, we have seen home sales decline. It appears home prices have been pulled up by tight supply because inventory remains lower than pre-pandemic levels as existing homeowners with locked-in low mortgage rates are content to stay where they are.
Low Inventory Leads to Higher Home Prices
Source: U.S. Census Bureau.
Recent Economic Releases
| Indicator | Prior period | Current period (forecast) | Current period (actual) |
|---|---|---|---|
| Chicago Fed National Economic Activity Index (Aug.) | 3.8% | 3.0% | 3.0% |
| S&P U.S. Composite PMI (Sep.) | 0.5% | 0.5% | 0.3% |
| S&P CoreLogic Case Shiller U.S. National Home Price Index (Jul.)(YoY) | 1.2% | 1.1% | 0.9% |
| FHFA House Price Index (Jul.)(YoY) | 2.0% | 1.8% | 2.4% |
