economy
February 14, 2022
Eyes on the Economy: GDP, Interest Rates, Trade Deficit

Virus Stunts GDP Growth
The U.S. economy had a good 2021 for the most part. Fourth-quarter real gross domestic product (GDP) growth came in at 6.9 percent and the overall economy grew at 5.7 percent for the year. GDP growth would have been even stronger had it not been for the delta wave of the pandemic, which hit during the summer and stunted third-quarter results. Omicron is expected to have the same impact on first-quarter growth.
Most economists believe the drag on the economy will be short-lived with lost growth shifted to the second quarter. Besides the virus, other threats include equity and housing markets, which at the time appear overvalued. High gasoline and other consumer prices are eating into some consumers’ cash and hurting confidence. Also, geopolitical issues will slow foreign demand for U.S. products. That said, potential upsides include the huge amount of cash consumers have saved over the past year and the potential productivity gains resulting from infrastructure and investment spending.
Fed Preps for March Liftoff
The minutes from the December Federal Open Market Committee meeting suggest the Federal Reserve is gearing up to remove policy accommodation, first by raising the target range for the federal funds rate and then by reducing the size of its balance sheet, otherwise known as Quantitative Tightening (QT). The tightening takes place as the Fed opts not to reinvest proceeds from maturing assets, allowing the balance sheet to shrink. Economists believe the QT process will start once the overnight interest rate is raised to 1 percent. The Fed has, on average, $60 billion to $70 billion of Treasuries maturing monthly next year. This provides a lot of flexibility in adjusting the tightening cycle. Look for QT to increase volatility in the bond and equity markets.
Trade Deficit Swells to Record Level in 2021
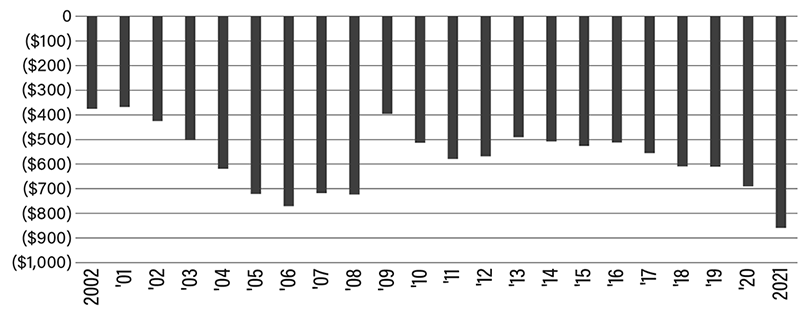
The U.S. trade deficit grew in 2021 to the largest recorded gap, reflecting a surge in the value of consumer-goods imports as the pandemic discouraged spending on services and drove more outlays for merchandise. The imbalance is expected to continue well into 2022.
The annual shortfall in goods and services increased for a second straight year, widening 26.9 percent to $859.1 billion, according to U.S. Commerce Department data. The December trade gap grew by $80.7 billion from the prior month, which was in line with economists’ expectations. The data reflect the effects of the second year of the pandemic on the world’s largest economy. Elevated savings spurred by government stimulus and a stronger dollar saw homebound Americans purchase more goods and invest in their homes. The result sparked a surge in inbound shipments that strained ports and logistics and also depleted inventories.
U.S. Goods and Services Annual Trade Balance (in Billions)
Recent Economic Releases
| Indicator | Prior period | Current period (forecast) | Current period (actual) |
|---|---|---|---|
| Fed Rate Increase Prediction (Mar.) | 0.25% | 0.25% | 0.25% |
| GDP Annualized (Q4) (QoQ) | 2.3% | 5.5% | 6.9% |
| PCE Deflator (Dec.) (YoY) | 5.7% | 5.8% | 5.8% |
| Trade Deficit (Dec.) (MoM) | $80.2B | $83B | $80.7B |