economy
January 18, 2022
Eyes on the Economy: Manufacturing Slows, 2022 Jobs

Manufacturing Slows, But Positive Signs Remain
The December report reveals the U.S. manufacturing sector remains in a demand-driven, supply chain-constrained environment, with indications of improvement in labor resources and supplier delivery performance. Manufacturing conditions softened last month as the Institute for Supply Management manufacturing index fell more than consensus anticipated, dropping to 58.7 from 61.1. The December reading shows expansion in the overall economy for the 19th month in a row after the contraction in April 2020.
The details are better than the headline would suggest. The bulk of the decline can be attributed to a drop in the supplier deliveries index, which fell to 64.9 from 72.2, indicating the month saw speedier deliveries but doesn’t fully capture the impact of the omicron variant of COVID-19. The supplier deliveries index reduced the headline index by 1.5 points.
New orders and production fell modestly while employment edged higher. There was a sizable decline in prices paid, dropping from 82.4 to 68.2. This is the most surprising detail, but it doesn’t have any implications for monetary policy because the Federal Reserve is more concerned with consumer prices.
All told, manufacturing should continue to contribute positively to gross domestic product growth this year as businesses replenish inventories and supply-chain issues improve. There are risks, however, including the potential for businesses to overbook orders now and the omicron variant to magnify supply-chain woes.
2022 Jobs: Expect Labor Shortages, Wage Pressure
December’s labor report came in with mixed market reviews. The economy did add 199,000 jobs, which pushed the unemployment rate down to a new pandemic low of 3.9 percent. That’s just slightly above the 50-year low of 3.5 percent tallied just before the pandemic hit. Economists were expecting a much bigger number—something greater than 400,000—but inflation, labor shortages and supply-chain disruptions continue to weigh on the labor market and make it hard to predict what will happen next.
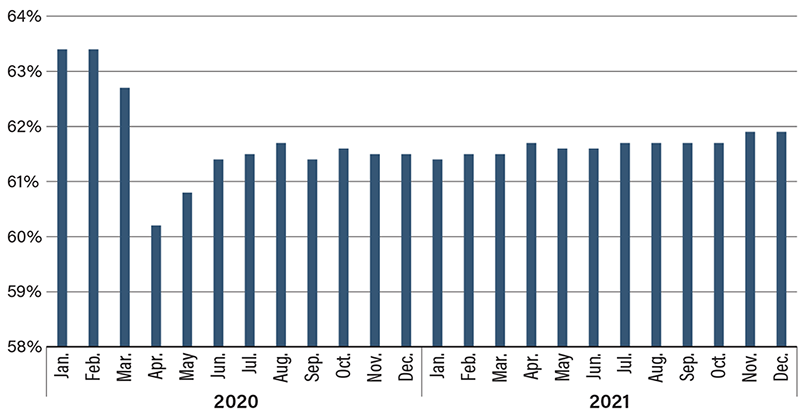
Average hourly earnings increased by 4.7 percent on the year, according to the Bureau of Labor Statistics, but some sectors, such as bars and restaurants, have seen much higher wage growth. The report also showed that 2 million Americans left the workforce during the pandemic, causing the country’s labor participation rate to sink. It now stands at 61.9 percent, well below the 63.4 percent it was February 2020. The pandemic prompted many people to retire early, stay home to care for children or family members, or avoid jobs with significant risks of exposure as they wait for the public health picture to improve. Labor shortages, talent retention and corresponding wage pressure are likely to be challenges for businesses well into 2022.
U.S. Labor Participation Rate 2020–2021
Recent Economic Releases
| Indicator | Prior period | Current period (forecast) | Current period (actual) |
|---|---|---|---|
| ISM Manufacturing (Dec.) (MoM) | 61.1 | 60.0 | 58.7 |
| Nonfarm Payrolls (Dec.) (MoM) | 210K | 450K | 199K |
| Average Hourly Wage (Dec.) (YoY) | 4.8% | 4.2% | 4.7% |