Eyes on the Economy: Home Prices, Consumer Confidence, Jobs

Home Prices Break Records Once Again
The May S&P CoreLogic Case-Shiller National Home Price Index broke the previous month’s all-time high, marking a third straight month of shattered records. U.S. home prices increased 5.9% from a year ago, a deceleration from April’s 6.4%. Although gains were broad based, cities saw bigger rises in home prices. New York City saw the highest annual price growth of all 20 cities, posting a 9.4% increase.
The Federal Housing Finance Agency Housing Index, which covers average prices of single-family homes with mortgages guaranteed by Fannie Mae and Freddie Mac, was unchanged from the previous month’s all-time high. The index posted a year-over-year increase of 5.7% in May, the smallest jump in 10 months.
Meanwhile, new- and existing-home sales have been falling as high prices and mortgage rates continue to weigh on affordability, suggesting that, while there is some pullback on the demand side, sellers are unwilling to cut prices.
Consumer Confidence Improves
The Conference Board Consumer Confidence Index rose to 100.3 in July from June’s downwardly revised 97.8. The increase was largely driven by improvement in views on short-term business conditions and short-term income prospects. However, consumers’ appraisal of the labor market, while still fairly good, deteriorated compared with the previous month. Elevated prices and interest rates remain among top concerns.
Confidence also varied based on age groups. Those under 35 and those 55 or older appeared more optimistic while those aged 35 to 55 became more pessimistic. Overall, consumers’ assessment of their family’s current financial conditions weakened while their perceived likelihood of a U.S. recession within the next 12 months ticked up but remained below its 2023 peak.
Job Openings Continue Downward Trend
The number of job openings in June edged slightly lower from May, continuing a downward trajectory. Openings remained above the pre-COVID levels, leading many to suggest the job market is still strong. However, such a view does not account for population growth. An economy with a growing population—albeit at lower rates—should be growing job openings as well. The number of unemployed workers per job opening was 0.8 in June—exactly the same level it was in February 2020. This suggests the labor market is just as tight (or loose) as pre-COVID. From this perspective, the labor market is normalized for the moment, but if the current trend continues it will be more than normalizing.
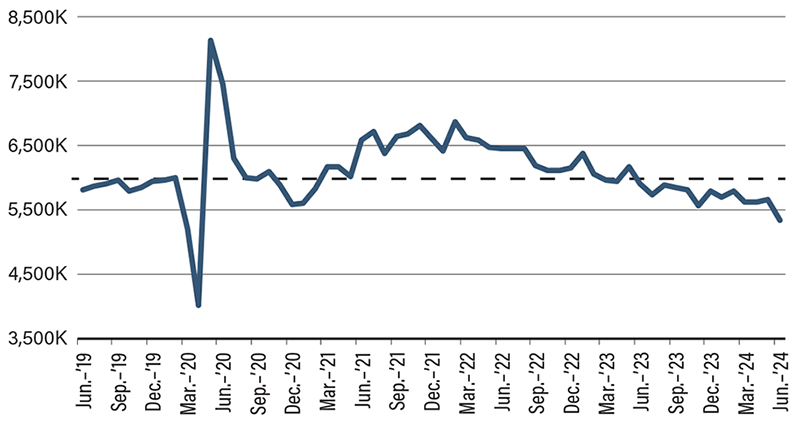
For both employers and workers, the number of job openings is not as important as the number of hires. After all, job openings that do not result in hires do not add value to the economy, employers or workers. In June, the number of total hires dropped to 5,341,000 from May’s 5,655,000—below the February 2020 level of 5,997,000. Meanwhile, the quits rate fell to 2.1% in June, which is slightly below its pre-COVID rate of 2.3%. Both indicators suggest the labor market is declining rather than stabilizing.
Total Hires Trend Below Pre-COVID Level

Source: Trading Economics.
Recent Economic Releases
| Indicator | Prior period | Current period (forecast) | Current period (actual) |
|---|---|---|---|
| S&P CoreLogic Case-Shiller Home Price Index (May)(YoY) | 6.4% | N/A | 5.9% |
| FHFA House Price Index (May)(YoY) | 6.5% | 6.1% | 5.7% |
| Consumer Confidence (Jul) | 97.8 | 99.7 | 100.3 |
| JOLTS Job Openings (Jun) | 3.4M | 3.5M | 3.3M |
