economy
November 13, 2023
Eyes on the Economy: Household Debt, Factory Orders, Labor Market

Household Debt Skyrockets
Total U.S. household debt reached $17.3 trillion in the third quarter, posting a new record high and 1.3% increase from the previous quarter. This marks a $3.1 trillion increase from the final quarter of 2019, just before the pandemic began. The aggregate delinquency rate also rose in the third quarter but is still below pre-COVID levels. However, it must be noted that missed federal student loan payments are not reported until the final quarter of 2024. Thus, the delinquency rate for this category appears low in official data until year-end, even if there’s a rise in missed payments.
Mortgage originations slightly declined from the previous quarter and fell well below the robust quarterly origination volumes between 2020 and 2021. It’s clear that higher mortgage rates have not been compensated by lower home prices, leading to declining sales.
Credit card debt continued to break records, increasing for eight consecutive quarters and posting a record high year-over-year increase of $154 billion. Delinquencies rose across all categories but were most pronounced for those aged 30 to 39, lowest income earners and those who also have auto and student loans.
Factory Orders Increase
New orders for manufactured goods increased 2.8% in September on a month-over-month basis, the biggest rise since January 2021. The increase was largely driven by a surge in new orders for durable goods of 4.6%, rebounding from two consecutive months of declines, thanks to orders for transportation equipment.
When excluding transportation, the monthly increase was 0.8%, easing from 1.5% in the previous month. Factory orders excluding transportation averaged 0.26% since 1992. Typically, an increase in factory orders indicates economic expansion. However, one must take caution in reading this indicator as it is reported in nominal dollars and, therefore, doesn’t account for inflation.
Labor Market May Be Approaching a Turning Point
The U.S. economy added 150,000 jobs in October, well below market forecasts of 180,000. September’s blowout job growth was also revised down to 297,000—still high but much lower than previously reported. The unemployment rate edged up to 3.9% in October, following a 3.8% in the previous two months. The last three-month trend indicates the unemployment rate may break 4% by year-end.
The labor force participation rate edged down from 62.8% to 62.7%, suggesting that the rise in the unemployment rate was driven not by looser supply but declining demand for labor. The average weekly hours worked also dropped slightly from 34.4 to 34.3. Overall, the measure has been trending down and back in line with, or even marginally lower than, pre-COVID levels. Also noteworthy is the end of the Great Resignation era as the quits rate has been steady at 2.3%, right at the February 2020 pre-COVID level. While the decline in workers quitting their jobs should be welcome news for employers, some have expressed concerns that the steep decline in turnover in recent months has left some companies over-budget on certain teams, according to The Wall Street Journal. Overall, this fall looks to be a turning point for the labor market.
Labor Market Has Been Mostly Cooling This Year
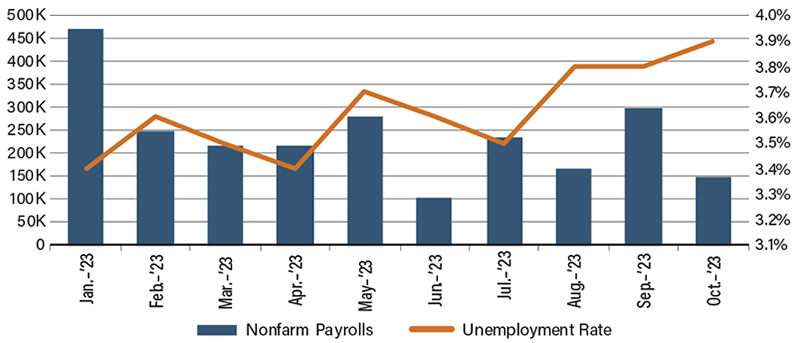
Source: U.S. Bureau of Labor Statistics
Recent Economic Releases
| Indicator | Prior period | Current period (forecast) | Current period (actual) |
|---|---|---|---|
| Total Household Debt (Q3 2023) | $17.06 T | N/A | $17.29 T |
| Factory Orders (Sep.)(MoM) | 1.0% | 2.4% | 2.8% |
| Nonfarm Payrolls (Oct.) | 297K | 180K | 150K |
| Unemployment Rate (Sep.) | 3.8% | 3.8% | 3.9% |
