economy
October 6, 2025
Housing, Inflation, Consumer Sentiment

US Housing Market Has Cooled
The S&P Cotality Case-Shiller (formerly known as S&P CoreLogic Case-Shiller) National Index recorded a modest annual gain of 1.7% in July. However, prices fell month-over-month in 15 of the 20 major metros, reinforcing that the market has shifted into a slower gear even during peak buying season. The geographic balance of housing strength continues to change dramatically. New York led all metros with a 6.4% annual gain, followed closely by Chicago at 6.2% and Cleveland at 4.5%. Boston and Detroit also posted increases near 4%, highlighting how Northeastern and Midwestern markets—once pandemic laggards—are now outperforming. In contrast, several former high-flyers in the Sun Belt and West Coast are struggling. Tampa posted the weakest result of negative 2.8%, while Phoenix slipped 0.9%. Miami, once strong, is now down 1.3%. Las Vegas and Los Angeles slowed sharply to just 1.0% and 0.2% gains, respectively, and San Francisco and San Diego were down 1.9% and 0.7%, respectively.
Fed’s Preferred Inflation Gauge Hits Six-Month High
The personal consumption expenditures (PCE) price index rose 2.7% year-on-year in August, the highest in six months and up from 2.6% in June and July, matching market expectations. On a monthly basis, the index increased 0.3% after a 0.2% rise in July. Goods prices rebounded 0.1% following a 0.1% decline, while services advanced 0.3%, the same as the prior month. Core PCE, which excludes food and energy, climbed 0.2%, in line with forecasts and unchanged from July’s revised figure. Food costs rose 0.5% after a 0.1% drop previously, and energy prices rebounded 0.8% after falling 1.1%.
PCE is the Federal Reserve’s preferred inflation gauge and serves as key data driving the central bank’s decision in setting interest rates. The persistently elevated inflation puts the Fed in a difficult position as it pivots to focusing on the weakening labor market.
Consumer Sentiment Slips in September as Inflation Worries Persist
The University of Michigan Consumer Sentiment Index declined to 55.1 in September, slipping about 5% from August but still holding above the lows recorded in April and May. The decline, though modest, was broad-based—spanning age, income, education groups and all five index components. The main exception came from households with larger stock holdings, where sentiment was steady, while those with fewer or no holdings saw declines. Politically, sentiment fell 9% among independents and 4% among Republicans but edged higher for Democrats.
Expectations weakened across the board, not only for the broader economy but also for personal finances. Consumers cited a dimmer outlook for labor markets, business conditions and their own incomes. Frustration with elevated prices remained a key theme: 44% of respondents spontaneously mentioned that high prices are eroding their financial standing—the highest share in a year. Interviews reflected concerns about both persistent inflation and potential labor market weakness.
On inflation expectations, the one-year outlook eased slightly to 4.7% from 4.8% in August. However, long-run expectations climbed for the second consecutive month to 3.7%, still well below April’s 4.4% spike, underscoring reduced but lingering inflation worries.
Consumer Sentiment Continues to Decline
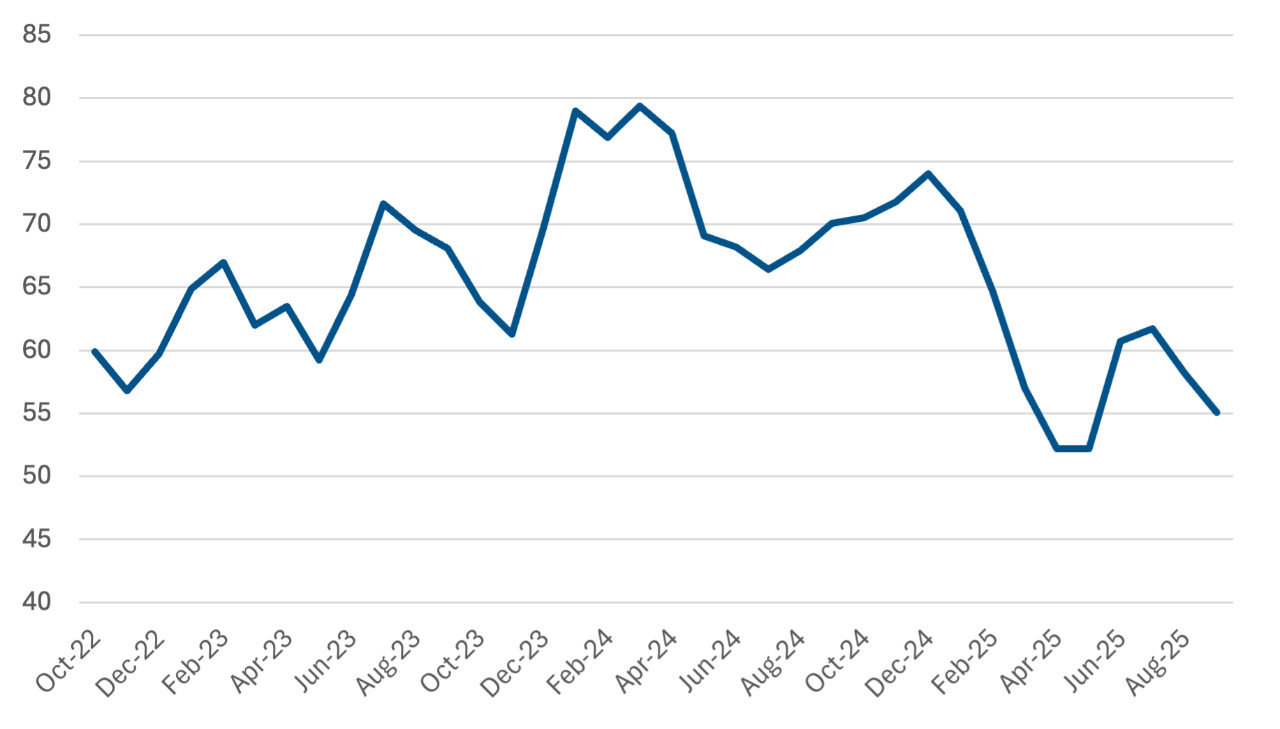
Source: Trading Economics.
Recent Economic Releases
| Indicator | Prior period | Current period (forecast) | Current period (actual) |
|---|---|---|---|
| S&P Cotality Case-Shiller National Home Price Index (July)(YoY) | 1.9% | N/A | 1.7% |
| PCE Price Index (Aug.)(YoY) | 2.6% | 2.7% | 2.7% |
| Core PCE Price Index (Aug.)(YoY) | 2.9% | 2.9% | 2.9% |
| University of Michigan Consumer Sentiment (Sept.) | 58.2 | 55.4 | 55.1 |
