economy
November 7, 2022
Eyes on the Economy: Housing, Trade, Interest Rates

Housing Slump Continues
As the Federal Reserve continues to tighten the economy, declines in the housing market reflect rising mortgage rates. Pending home sales dropped 31 percent in September from a year ago, the largest year-over-year contraction since April 2020. Compared with the previous month, the indicator fell 10.2 percent. The biggest monthly decline was in the Northeast (-16.3 percent), followed by the South (-11.7 percent), the Midwest (-8.8 percent) and the West (-8.1 percent). The weakening sales across the country reflect the drop in demand as buyers are deterred by rising rates while home prices have not fallen enough to compensate for the higher borrowing costs.
Building permits, a leading indicator of future construction, increased 1.4 percent in September on a month-over-month basis after a sharp decline in August. The modest increase after a large drop is not enough to point to a relief in supply shortages.
Trade Balance Lifts Growth
Real gross domestic product (GDP) grew at an annualized rate of 2.6 percent in the third quarter after two consecutive quarters of negative growth. Note that the growth rate is quarter-over-quarter, meaning that the base for the third-quarter growth is the second-quarter real GDP, which was in negative territory. Thus, we are looking at a 2.6 percent increase from a low base. Nonetheless, it still marks an improvement—largely thanks to an improved trade balance.
The third quarter saw continued export increases, reflecting high demand for goods in industrial supplies and for services led by travel. Meanwhile, the value of imports fell as the strong dollar affords Americans more foreign goods for less. However, rising domestic currency may hurt exports in the near future. Consumption, on the other hand, decelerated as an increase in services was offset by a decline in goods purchases.
Fed Implements Another Hefty Rate Hike, But Pace May Slow
The Federal Open Market Committee (FOMC) once again raise its target federal funds rate by 75 basis points, lifting the rate to 4 percent. The much-anticipated hike came with no surprise. However, the FOMC November meeting was watched for a potential shift in the Fed’s tone and rate hike path.
The key takeaway from the meeting is that Fed officials anticipate ongoing rate hikes aiming for a level where rates are “sufficiently restrictive” to return inflation to 2 percent. The FOMC notes that decisions on future rate hikes “will take into account the cumulative tightening of monetary policy, the lags with which monetary policy affects economic activity and inflation, and economic and financial developments.” This suggests tightening may begin to slow at the next meeting. While rates will peak higher than once anticipated, we are now looking at a future slowdown of the pace of hikes, with the December meeting potentially resulting in a hike of 50 basis points.
Fed Chairman Jerome Powell suggested that the probability of a soft landing—a case where rates rise high enough to curb inflation without tipping the economy into a recession—has declined. Losses in the equity market worsened after the Fed press conference was concluded.
Federal Funds Rate (2019–2022)
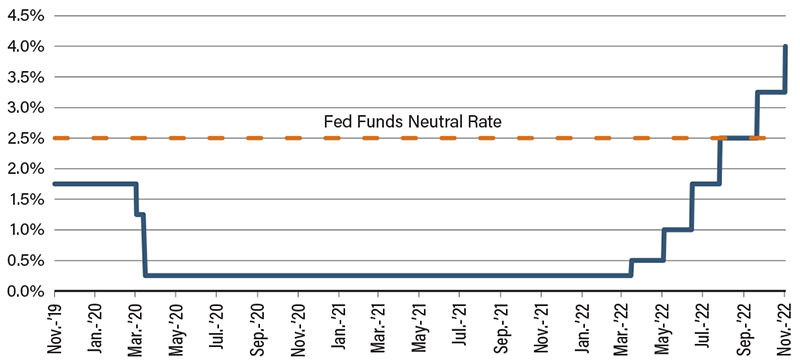
Source: Bloomberg
Recent Economic Releases
| Indicator | Prior period | Current period (forecast) | Current period (actual) |
|---|---|---|---|
| NY Empire State Manufacturing Index (Oct.) | -1.5 | -4.0 | -9.1 |
| U.S. Manufacturing Production (Sep.)(MoM) | 0.4% | 0.2% | 0.4% |
| NAHB Housing Market Index (Oct.) | 46 | 43 | 38 |
| Core Consumer Price Index (Sep.)(YoY) | 6.3% | 6.5% | 6.6% |
