economy
September 26, 2022
Eyes on the Economy: Industrial Production, Inflation, Interest Rates

Industrial Sector Slows
U.S. industrial production declined 0.2 percent between July and August, missing the market forecast of an increase of 0.1 percent. On a year-over-year basis, however, industrial production is still in an expansion mode, although it slowed for a fourth consecutive month. Industrial production measures the output of the industrial sector of the economy—of which manufacturing accounts for more than two-thirds of the tally while mining and utilities account for roughly 11 percent each.
Manufacturing rose 0.1 percent in August, slowing from July’s month-over-month rate of 0.6 percent. Nevertheless, the modest increase was outweighed by a decline of 2.3 percent in the utilities sector while mining was unchanged. Overall, the data point to deceleration of the industrial sector.
Inflation Data Remain a Complicated Matter
Year-over-year, the headline Consumer Price Index (CPI) edged down for a second consecutive month in August. Unfortunately, the reading was not greeted with joy. Rather, it sparked the worst day of the year for the equity market as major stock indices immediately flashed red after the release. Yes, the yearly rate was higher than expectations, but inflation data are quite complicated.
A year-over-year comparison is often mistaken for a change in price levels, when in fact it is a comparison of the size of price growth in two periods. It is the month-over-month rates that reflect a continued increase—or otherwise—of price levels. Unfortunately, monthly headline CPI rose 0.1 in August after posting no increase at all in July. Furthermore, core inflation—which excludes energy and food—increased in both yearly and monthly measures, proving that inflation is not mostly driven by high energy prices as many once argued. Blaming inflation on external factors—e.g., Ukraine war—that are beyond the control of the Federal Reserve is no longer a convincing argument.
Fed Surprises Markets; Outlook Gets More Hawkish
The verdict is in: The Federal Open Market Committee (FOMC) raised its federal funds target rate by another 75 basis points, bringing it to 3.25 percent. The widely expected move came after August’s inflation did not soften as much as anticipated. The Fed also predicted its target rate will reach 4.4 percent by year-end and 4.6 percent in 2023, much higher than previously anticipated. The central bank then forecasts its policy rate will fall to 2.9 percent in 2025—suggesting that a restrictive monetary environment will remain in place until then.
While markets were expecting the supersized hike, they were wrong in the outlook for future rate hikes. Wall Street was betting on the Fed beginning to lower its target rate next year and was not anticipating the rate would go over 4 percent. The markets have been repeatedly wrong on this matter. It is clear that Wall Street has not only underestimated the Fed’s commitment to restoring price stability but also misunderstood how the Fed sees the current nature of inflation. The Fed was not bluffing when it said the current inflation is more dangerous than a recession. So brace yourself: Winter, or a recession, is coming.
Median Federal Funds Rate Forecast
(June 2022 vs. September 2022)
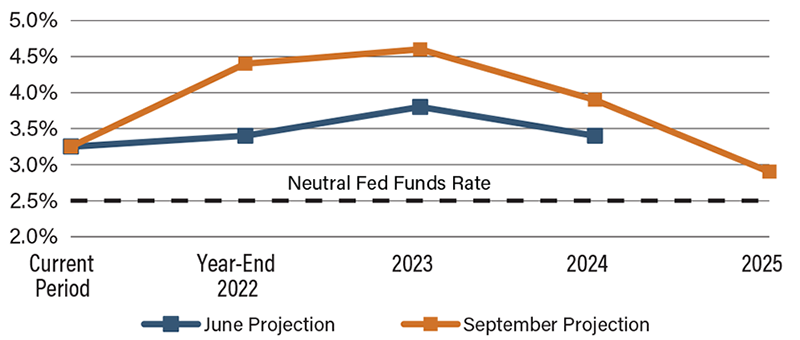
Source: Bloomberg
Recent Economic Releases
| Indicator | Prior period | Current period (forecast) | Current period (actual) |
|---|---|---|---|
| Industrial Production (Aug.)(MoM) | 0.5% | 0.1% | -0.2% |
| Consumer Price Index (Aug.)(YoY) | 8.5% | 8.1% | 8.3% |
| Core Consumer Price Index (Aug.)(YoY) | 5.9% | 6.1% | 6.3% |
| Federal Funds Rate | 2.50% | 3.25% | 3.25% |
