Eyes on the Economy: Industrial Production, Leading Indicators, Homebuilder Confidence

Strike, Hurricanes Impact Industrial Production
U.S. industrial production decreased 0.3% in September month-over-month, largely driven by a strike at a major civilian aircraft builder and two hurricanes. On a year-over-year basis, the measure declined 0.6%. Overall output in manufacturing fell 0.5% from a year ago while mining output was 2.2% below its year-earlier level, as the impact of hurricanes outweighed gains elsewhere. Meanwhile, the output of utilities rose 0.6% from a year ago as both electric and natural gas utilities moved up.
Capacity utilization, the rate at which potential output levels are being met or used, dropped to an eight-month low of 77.5%, a rate that is 2.2 percentage points below its 1972–2023 long-run average.
Leading Indicators Fall, Signaling a Downturn
The Conference Board Leading Economic Index (LEI) fell 0.5% in September, following a decline of 0.3% in August. LEI is a composite of economic indicators that provide an early indication of significant turning points in the business cycle and where the economy is heading in the near term. The decline was largely driven by a decrease in new factory orders, a weak housing market and deteriorating consumer expectations for business conditions. LEI once again is signaling a near-term recession.
Meanwhile, the Coincident Economic Index (CEI)—a composite of coincident indicators that signal the current economic conditions—edged up 0.1% in September and overall increased 0.9% in the six-month period ending in September. As coincident indicators move simultaneously with the general economic conditions, the positive reading indicates the economy is not yet in a recession. Together, the LEI and CEI readings suggest that, while economic indicators are signaling a potential downturn in the near term, the economy is still growing. Meanwhile, the Producer Price Index—a measure of wholesale inflation—eased to 2.2% year-over-year in July, after rising in the previous months. The reading falls slightly below market expectations of 2.3%. Excluding food and energy, the index eased from 3% in June to 2.4% in July. Overall, both consumer and wholesale inflation readings are signs that the Federal Reserve may be ready to make a rate-cut move in September. Although the month-over-month reading of consumer inflation suggests a slight acceleration, the central bank is unlikely to hold longer, unless the year-over-year trend reverses in the next release.
Homebuilder Confidence Sees Slight Improvement
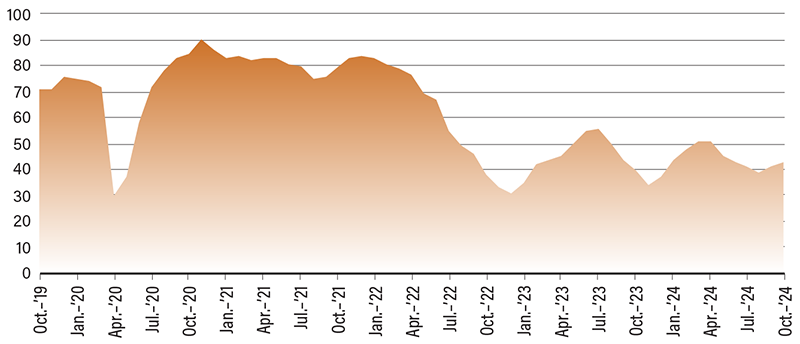
The National Association of Home Builders (NAHB) Housing Market Index edged up to 43 in October from 41 in September. This reflects slightly higher confidence among home builders as there was improvement in current sales conditions, sales expectations in the next six months and traffic of prospect buyers. This came as the Federal Reserve cut its overnight rate for the first in the current cycle by 50 basis points.
Housing affordability remains an issue. The expected interest rate declines are likely to improve demand, which will put upward pressure on prices. The balance then depends on supply to offset. However, building permits and housing starts—both proxies for future new housing supply—declined in September. Overall, housing inventory—new and existing homes—is approaching its pre-COVID levels, but the pent-up demand may continue to keep the housing market imbalanced, maintaining high home prices. Existing homeowners have proven resilient so far, being able to refuse taking price cuts despite low demand. As housing is a necessity and rent inflation remains high, home buyers will likely be the ones to give in and accept high home prices until it’s no longer financially possible.
Homebuilder Confidence Improves But Remains Low

Source: Trading Economics.
Recent Economic Releases
| Indicator | Prior period | Current period (forecast) | Current period (actual) |
|---|---|---|---|
| Industrial Production (Sept.)(YoY) | (0.2%) | 0.4% | (0.6%) |
| Capacity Utlization (Sept.) | 77.8% | 77.8% | 77.5% |
| Leading Economic Index (Sept.)(MoM) | (0.3%) | (0.3%) | (0.5%) |
| NAHB Housing Market Index (Oct.) | 41 | 42 | 43 |
