economy
February 26, 2024
Eyes on the Economy: Inflation, Industrial Production, Residential Construction

Wholesale Inflation Hits Five-Month High
The Producer Price Index (PPI), a measure for wholesale price inflation, increased 0.3% month-over-month in January, the highest tally since August 2023 and well above expectations of a 0.1% drop. PPI for services rose 0.6%, led by a 2.2% increase in hospital outpatient care prices. PPI for goods declined 0.2%. Core PPI—excluding food and energy—jumped 0.5%, the biggest increase since July and sharply above the forecast of 0.1%. January’s wholesale inflation, along with the latest release of the Consumer Price Index, has caused markets to reverse optimism for the disinflation progress seen in late 2023.
You may recall that CFC’s expert analysis in the “2024 Economic and Industry Trends Report” stated there is a high risk of inflation resurging or plateauing above the Federal Reserve’s target rate. It appears the trend started as soon as the year kicked off. With all signs pointing to persistent inflation, the hope for early rate cuts has faded. Uncertainty about the future policy rate path is once again increasing, potentially leading to more volatility in the long-term rate market.
Industrial Production Slips
U.S. industrial production declined 0.1% month-over-month in January after posting no change in December. Mining output also decreased 2.3% driven by a pullback in oil and gas extraction due to winter weather and a decline in coal production. Similarly, manufacturing output fell 0.5% largely driven by weather-related declines. Meanwhile, utilities jumped 6% as the big change in temperatures between December and January led to a surge in heating. Year-over-year, industrial production posted no growth.
January’s capacity utilization, the rate at which potential output levels are being met or used, dropped to 78.5%, the lowest level since September 2021 and below market forecasts of 78.8%.
New Residential Construction Declines in January
Housing starts, a leading indicator for future new home availability, slumped 14.8% in January from a month ago to a seasonally adjusted annualized rate (SAAR) of 1.33 million. Building permits, a leading indicator of future construction, decreased 1.5% to a SAAR of 1.47 million. Meanwhile, housing completions came in at a SAAR of 1.42 million in January, an 8.1% decline from December. Overall, new construction has struggled to catch up with demand.
At the same time, existing-home sales have steadily declined. With few new and old homes available in the market, inventory remains low, keeping supply and demand imbalanced. Depending on the measures, declines in home prices have been very marginal—if any at all—and remain far above pre-COVID levels. As a result, the rental market shows no sign of relief. Rent inflation remains above 6%. Cost of housing has been by far the largest contributor to the overall inflation. Without curbing housing inflation, the overall inflation will struggle to return to its target rate. While many factors contribute to housing inflation, supply-demand imbalance is the key driver, with demand being stimulated by the federal government for years, if not decades.
Home Prices Increase as Inventory Declines
(Not Seasonally Adjusted)
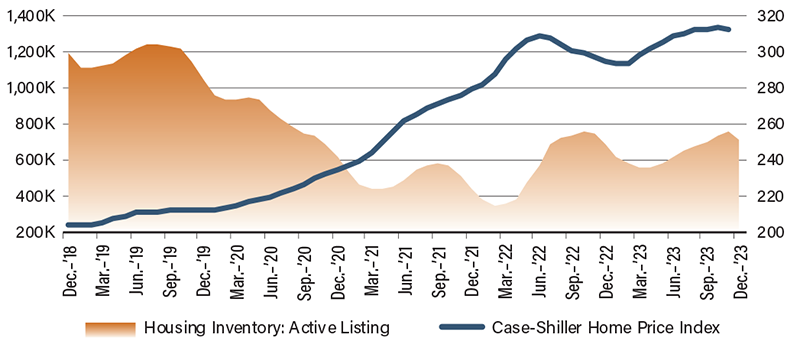
Source: Federal Reserve of St. Louis.
Recent Economic Releases
| Indicator | Prior period | Current period (forecast) | Current period (actual) |
|---|---|---|---|
| Producer Price Index (Jan.)(MoM) | (0.1%) | 0.1% | 0.3% |
| Industrial Production (Jan.)(MoM) | 0.0% | 0.3% | (0.1%) |
| Housing Starts (Jan.) | 1.56M | 1.46M | 1.33M |
| Building Permits (Jan.) | 1.49M | 1.51M | 1.47M |
