economy
May 23, 2022
Eyes on the Economy: Labor, Inflation, Trade Prices

Labor Market Is Tight; Productivity Is Low
The U.S. labor market remains hot with no sign of slowing. April carried on momentum from March with the same number of jobs added. The supply side, however, continued to struggle to meet demand. The labor force participation rate edged down to 62.2 percent, slightly below March’s figure of 62.4 percent and also below forecasts of 62.5 percent. Average hourly earnings grew 5.5 percent from a year ago.
Despite high demand and rising hourly earnings, U.S. workers have been less productive with nonfarm labor productivity declining at an annualized rate of 7.5 percent in the first quarter of 2022. This is the largest quarterly decline since 1947. Meanwhile, unit labor costs increased 11.2 percent, reflecting the rising hourly compensation coinciding with the decreasing productivity. Both factors make it more expensive to produce goods and services, further adding inflationary pressure on supply.
Inflation May Have Peaked
The latest Consumer Price Index (CPI) release has both good news and bad news. The good news is inflation may have peaked as April’s year-over-year headline CPI was 8.3 percent, a small decline from March’s 8.5 percent. This means we may expect inflation to move downward from now on. However, the bad news is that the marginal decline suggests inflation may be sticky and take longer to cool.
A closer look at the breakdown of the inflation figure tells a complex story. Year-over-year core inflation—headline CPI less energy and food—was 6.2 percent, slightly below March’s 6.5 percent. However, on a month-over-month basis, April’s figure was 0.6 percent, double that of March. This suggests core inflation was still rising in April on a monthly basis.
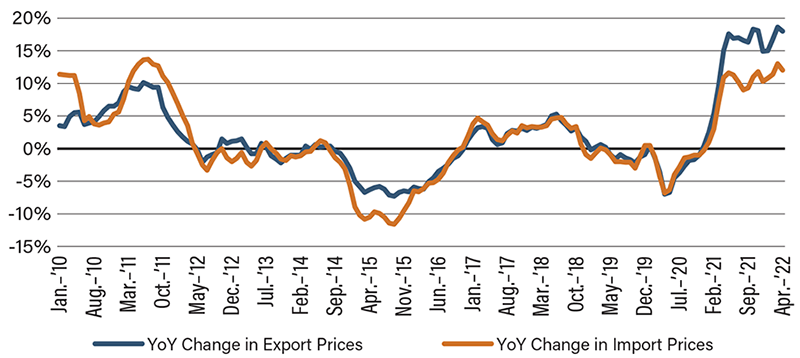
Export Prices Rise Faster Than Import Prices
Both import and export prices advanced at a marginally slower year-over-year pace in April than March, reflecting inflation edging down here and abroad. Export prices—the prices of U.S.-produced goods sold abroad—rose 18 percent in April from the year before. Over the same period, import prices rose 12 percent. The disparity suggests that prices of U.S.-produced goods increased faster than prices of goods produced abroad. This likely indicates the U.S. was experiencing higher growth of production costs than many of its trading partners. Additionally, the U.S. dollar is strong.
While April’s export price growth is slightly lower than March’s figure, it is still well above January and February’s figures, indicating stubbornly high inflationary pressure on U.S.-produced goods. Over the past 10 years, import and export prices tended to grow at a similar pace. However, export prices have grown significantly faster than import prices since mid-2021.
The disparity between the growth of import prices and that of export prices can sometimes be overlooked. But if we recall the recent discussion of the unexpected negative gross domestic product (GDP) growth in the first quarter of 2022, the trade deficit was the leading contributor to negative growth. As U.S.-produced goods became more expensive, exports declined in comparison to imports, illustrating how domestic inflation can hurt GDP growth.
The decline in government expenditure was warranted as COVID-relief spending came to an end. The rising trade deficit and declining private inventory, however, are cause for concern. Despite many dismissing it as a volatile factor, change in inventory is an important leading indicator, especially at a time when the economy is fragile. The account measures how much companies increase their inventories in anticipation of sales. A decline indicates that businesses expect slowing demand. With high inflation in the picture, it is an important puzzle piece in understanding what is coming as consumers battle price pressure. Nonetheless, a single quarter of negative growth does not cast a spell on the economy with fundamentals such as employment and business investment remaining strong.
Export Prices Rising Faster than Import Prices
Source: U.S. Bureau of Economic Analysis
Recent Economic Releases
| Indicator | Prior period | Current period (forecast) | Current period (actual) |
|---|---|---|---|
| Nonfarm Payrolls (Apr.)(MoM) | 428K | 415K | 428K |
| Nonfarm Labor Productivity (Q1 22)(QoQ) | 6.6% | -2.5% | 7.5% |
| Headline CPI (Apr.)(YoY) | 8.5% | 8.3% | 8.2% |
| Export Prices (Apr.)(YoY) | 18.6% | 20% | 18% |
