economy
January 30, 2024
Eyes on the Economy: Leading Indicators, Consumer Sentiment, Existing-Home Sales

Leading Indicators Continue To Decline
The Conference Board Leading Economic Index (LEI) fell 0.1% month-over-month in December after posting a decline of 0.5% in November. The LEI is a composite of leading indicators that provide early signals of turning points in the business cycle. A decline indicates an upcoming economic downturn.
Although the monthly decline was getting smaller, the LEI has been falling since 2022. Leading economic indicators have been signaling underlying weakness in the U.S. economy for more than a year, though their effect has been masked by high spending and post-COVID recovery. The Coincident Economic Index, which moves simultaneously with current economic conditions, continues to grow, indicating an economy in an expansion mode. This likely reflects economic expansion thanks to boosts driven by recovery after the recent recession rather underlying economic strength.
Consumer Sentiment Rallies
The University of Michigan’s consumer sentiment index increased to 78.8 in January, a significant improvement from 69.7 in December and well above the forecast figure of 70. It marks the highest posting since July 2021. The improved sentiment was driven by strengthening income expectations and the view that inflation has turned a corner. Despite the improvement, consumer sentiment remains significantly lower than pre-COVID levels.
Consumers’ view of current economic conditions jumped to 83.3 in January from 73.3 last month and 68.5 last year. While climbing, the figure remains well below its long-term average of 95.5.
Overall, consumer sentiment is improving, posting a nearly 60% increase from the all-time low in June 2022. The change reflects movement typical of consumer sentiment when the economy is emerging from a recession—despite the fact that a recession has not been called in the current cycle.
Existing-Home Sales Hit Lowest Rate in 13 Years
Existing-home sales posted a monthly decline of 1% in December to a seasonally adjusted annualized rate of 3.78 million units, marking the lowest level since August 2010. The falling number of existing-home sales continues to add downward pressure on total home inventory, keeping supply low and prices high. Discouraged by the prospect of giving up their locked-in low mortgage rates, homeowners are reluctant to put their houses on the market.
Home inventory has to rely more on new-home supply. Although builders have tried to increase constructions, leading indicators of new-home availability do not point to a significant supply boost in the future. Building permits increased 1.9% in December after a decline of 2.1% in November, while housing starts dropped 4.3% over the same period. Total inventory on the market remained well below pre-COVID levels. In reality, the issue is a lot worse than data suggest. The supply is strained, and when you account for population growth, we are looking at a much bigger imbalance between demand and supply. This has undoubtedly kept home prices high despite the increases in mortgage rates. The affordability issue shows no sign of improvement.
Existing-Home Sales Continue Downward Trend
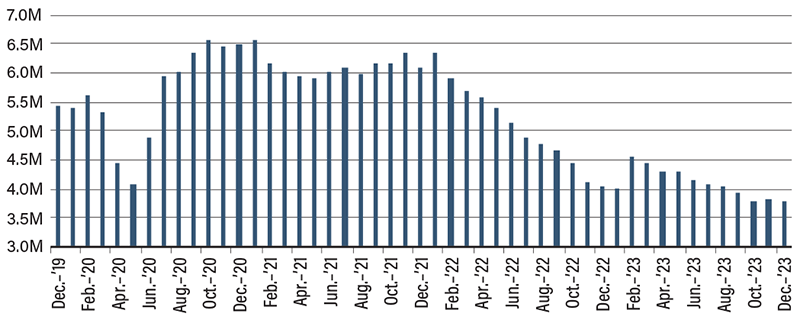
Source: National Association of Realtors.
Recent Economic Releases
| Indicator | Prior period | Current period (forecast) | Current period (actual) |
|---|---|---|---|
| Leading Economic Index (Dec.)(MoM) | (0.5%) | (0.3%) | (0.1%) |
| University of Michigan Consumer Sentiment (Jan.) | 69.7 | 70.0 | 78.8 |
| Existing-Home Sales (Dec.)(MoM) | 3.82M | 3.82M | 3.78M |
| Housing Starts (Dec.)(MoM) | 1.53M | 1.43M | 1.46M |
