economy
March 10, 2025
Eyes on the Economy: Manufacturing, Home Prices, Personal Spending
Manufacturing Stagnates
The Institute for Supply Management (ISM) Manufacturing Purchasing Managers’ Index fell from 50.9 in January to 50.3 in February, just slightly above the break-even point of 50, which implies stagnation. New orders and employment in the sector contracted while production decelerated significantly. Additionally, price pressures grew from 54.9 to 62.4 while supplier deliveries continued to slow.
According to ISM, demand eased and production stabilized while layoffs continued as the first operational shock due to expectations of tariffs hit manufacturers. Furthermore, tariff expectations led to accelerating price growth, resulting in “new order placement backlogs, supplier delivery stoppages and manufacturing inventory impacts.” Manufacturing has been struggling the past few years. Tariffs appear to add more pressure on the sector.
Home Prices Send Mixed Signals
S&P Case-Shiller National Home Price Index, which measures prices of U.S. residential real estate, declined 0.15% in December on a month-over-month basis. However, the index was still 3.9% higher than a year ago. On the other hand, House Price Index, which measures the average prices of single-family houses with mortgages guaranteed by Fannie Mae and Freddie Mac, continued to increase, posting a monthly gain of 0.4% and annual growth of 4.7% in December. According to the Federal Housing Finance Agency, prices grew at a slightly higher rate in the fourth quarter after three consecutive quarters of weaker price appreciation. The acceleration of price growth was driven by tightened inventory of homes for sale.
Growth in home prices varies across the country. Texas and Florida are seeing growing inventory as many new homes have been built in these states since 2020 while new constructions have been limited in states where red tape and high cost suppress new projects.
Personal Spending Sees Unexpected January Decline
Personal consumption expenditure declined 0.2% month-over-month in January, following an upwardly revised gain of 0.8% in December. Since February 2021, personal spending declined only one other month in March 2023. January’s reading missed market expectations of 0.1% growth. This might have been largely driven by severe weather.
There was a big drop in spending on goods, particularly durable goods, which decreased 3% in just one month. This decline was mostly driven by a sharp drop in car purchases. Meanwhile, growth in expenditures on services, which are typically the driving force of consumer spending, slowed from 0.7% in December to 0.3% in January.
As prices remain high, consumers are struggling to keep momentum. Recent data released by Moody’s Analytics indicate that nearly half of consumer spending comes from the top 10% of income earners. This paints an even less rosy picture of consumers than the aggregate consumer spending data suggest. While on the aggregate level, consumer spending remains solid, the bottom 90% of income earners are not spending nearly as much as initially thought, a sign of financial struggle and inequality of living standards.
Personal Spending (Month-over-Month)
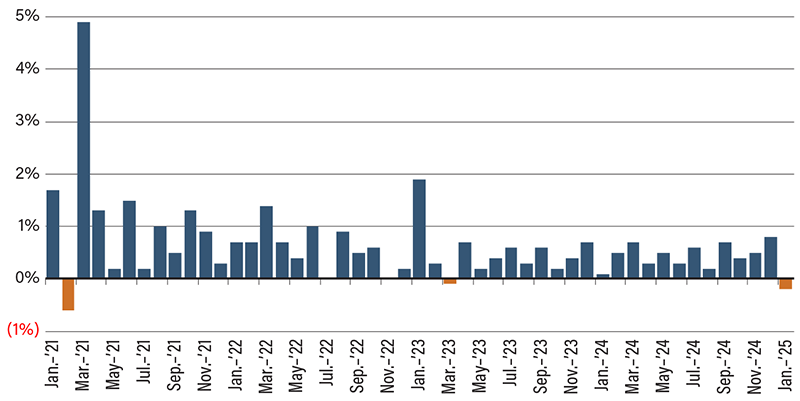
Source: U.S. Census Bureau.
Recent Economic Releases
| Indicator | Prior period | Current period (forecast) | Current period (actual) |
|---|---|---|---|
| ISM Manufacturing PMI (Feb.) | 50.9 | 51.0 | 50.3 |
| S&P Case-Shiller National Home Price Index (Dec.)(MoM) | (0.16%) | 77.8% | 77.5% |
| House Price Index (Dec.)(MoM) | 0.4% | 0.2% | 0.4% |
| Personal Spending (Jan.)(MoM) | 0.8% | 0.3% | (0.2%) |
