economy
October 24, 2022
Eyes on the Economy: Manufacturing, Housing, Inflation

NY Manufacturing Index Sends Mixed Signals
The New York Empire State Manufacturing Index fell below expectations to minus 9.1 in October, a third consecutive month of declines. The decline is largely driven by a drop in the sub-index for future business conditions, which fell 10 points to minus 1.8, marking the second-weakest reading since 2009. Nearly 36 percent of businesses expect the conditions to falter in the next six months.
U.S. manufacturing production, however, continued to grow at a monthly rate of 0.4 percent in September. The gains were broad-based within durable and nondurable manufacturing while publishing and logging fell. Manufacturing capacity utilization, which indicates how much factories produce compared with what they could potentially produce, increased to 80 percent. Overall, U.S. data appear to outperform that of New York State, a major manufacturing hub. Typically, a below-expectation New York manufacturing reading indicates a bearish condition of the U.S. dollar, but with the U.S. manufacturing production still growing, these are, at best, mixed signals.
Housing Market Still Falling
The Federal Reserve tightening cycle claimed its first victim: the housing market. The National Association of Home Builders (NAHB) housing market index fell for a 10th consecutive month to a reading of 38 in October. It marked the lowest reading since August 2012 (outside the pandemic-induced decline in 2020).
NAHB attributed the decline to rising interest rates, building material bottlenecks and elevated home prices. As mortgage rates approach 7 percent, first-time and first-generation prospective home buyers are priced out, lowering their demand. Current conditions for sales and sales expectations in the next six months dropped 9 points and 11 points, respectively. Traffic of prospective buyers also fell 6 points. Overall, the housing market has consistently declined since the tightening cycle began.
Don’t Be Fooled: Core Inflation Is Still Accelerating
If you think the year-over-year headline Consumer Price Index (CPI) reading drop to 8.2 percent in September from 8.3 percent in August is an indication that inflation is cooling, think again. The year-over-year reading is the change from the same month a year ago. Headline CPI was 5.3 percent in August 2021 and 5.4 percent in September 2021—both high. Thus, we are looking at big increases from already-high bases. While some experts justify 2021’s high inflation rates based on what they consider low bases in 2020, let us remind you that inflation, though low, never dropped below zero in 2020. In other words, there was no deflation in 2020 to justify the skyrocketing rates in 2021.
More importantly, core CPI—excluding food and energy—has been accelerating in the past three months. The beleaguered supply chain has been the go-to for blame, but that scapegoat has made improvements this year, from container costs to port congestion. The acceleration of core inflation does not reflect this. Not to take away from the supply chain challenges, but it is time to accept inflation is not simply a COVID problem.
A Four-Year Look at the Inflation Rate
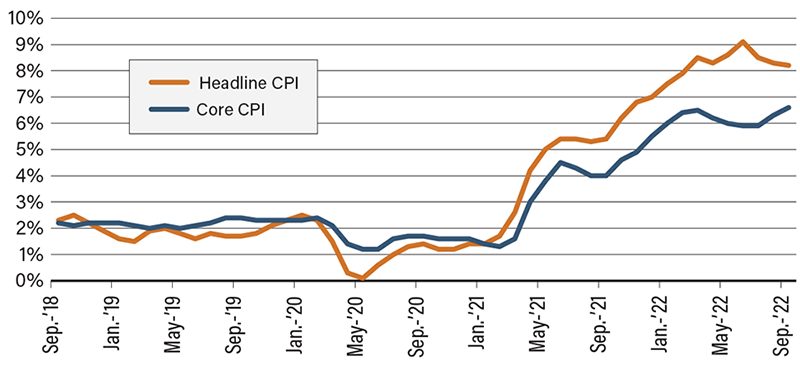
Source: Bloomberg
Recent Economic Releases
| Indicator | Prior period | Current period (forecast) | Current period (actual) |
|---|---|---|---|
| NY Empire State Manufacturing Index (Oct.) | -1.5 | -4.0 | -9.1 |
| U.S. Manufacturing Production (Sep.)(MoM) | 0.4% | 0.2% | 0.4% |
| NAHB Housing Market Index (Oct.) | 46 | 43 | 38 |
| Core Consumer Price Index (Sep.)(YoY) | 6.3% | 6.5% | 6.6% |
