economy
September 8, 2025
Eyes on the Economy: Manufacturing, Inflation, GDP Volatility

Manufacturing Contracts
U.S. manufacturing contracted for the sixth straight month in August, according to the Institute for Supply Management. The Manufacturing Purchasing Managers’ Index rose slightly to 48.7, up from July’s 48, but remained below the growth threshold of 50. New orders showed improvement, coming at 51.4 after six months of decline, though production fell back into contraction at 47.8. Prices continued to rise but at a slower pace, while employment and backlogs contracted further. Supplier deliveries slowed modestly, and inventories inched higher but stayed in contraction. Export orders improved, while imports weakened.
Overall, 69% of the manufacturing sector’s gross domestic product (GDP) contracted in August, a smaller share than July’s 79%, with only 4% in severe contraction. Seven industries reported growth, while 10 continued to decline.
Fed’s Preferred Inflation Gauge Remains Elevated
The Federal Reserve’s preferred inflation gauge, the Personal Consumption Expenditures (PCE) price index increased 2.6% year-on-year in July 2025, the same as in June and in line with market expectations. Excluding food and energy, the core PCE price index rose 2.9% from the previous year in July, the largest gain in five months and in line with market expectations.
Although inflation has remained stubbornly elevated, the Fed is facing calls to cut interest rates. Meanwhile, the labor market has shown clear signs of weakness. In his remarks at the Jackson Hole Economic Symposium, Fed Chair Jerome Powell suggested that labor market risk is rising, potentially leading to “sharply higher layoffs and rising unemployment.” The comment signaled a presumed shift from inflation fighting to restoring full employment. However, the current elevated inflation readings make the Fed’s upcoming decision about whether to cut rates a difficult one. The next Federal Open Market Committee meeting is Sept. 16–17.
Swings in Inventories, Imports Dominate GDP Volatility
The U.S. economy expanded at a 3.3% annualized quarterly rate in the second quarter of 2025, rebounding sharply from a 0.5% contraction in the first quarter, according to the second estimate of real GDP. The figure was nudged higher from the 3% reading in the first estimate.
Fluctuations in the first two quarters of 2025 were driven largely by business responses to tariffs. Consumption, normally the main growth driver, contributed modestly in both quarters, while investment and imports saw sharp swings. In the first quarter, inventory investment added 2.59 percentage points to GDP but was more than offset by imports, which subtracted 4.66 points. The surge in inventories reflected stockpiling ahead of tariff implementations, causing imports to soar as firms rushed to order goods before duties took effect.
In the second quarter, the pattern reversed. Inventories dropped sharply, subtracting 3.29 points from GDP as the stockpile surge ended. Meanwhile, imports fell after tariffs were imposed, adding 5.09 points to growth. Overall, tariff-related business adjustments, rather than underlying demand, were the main drivers of volatility in the first half of 2025.
Contributions to GDP Growth
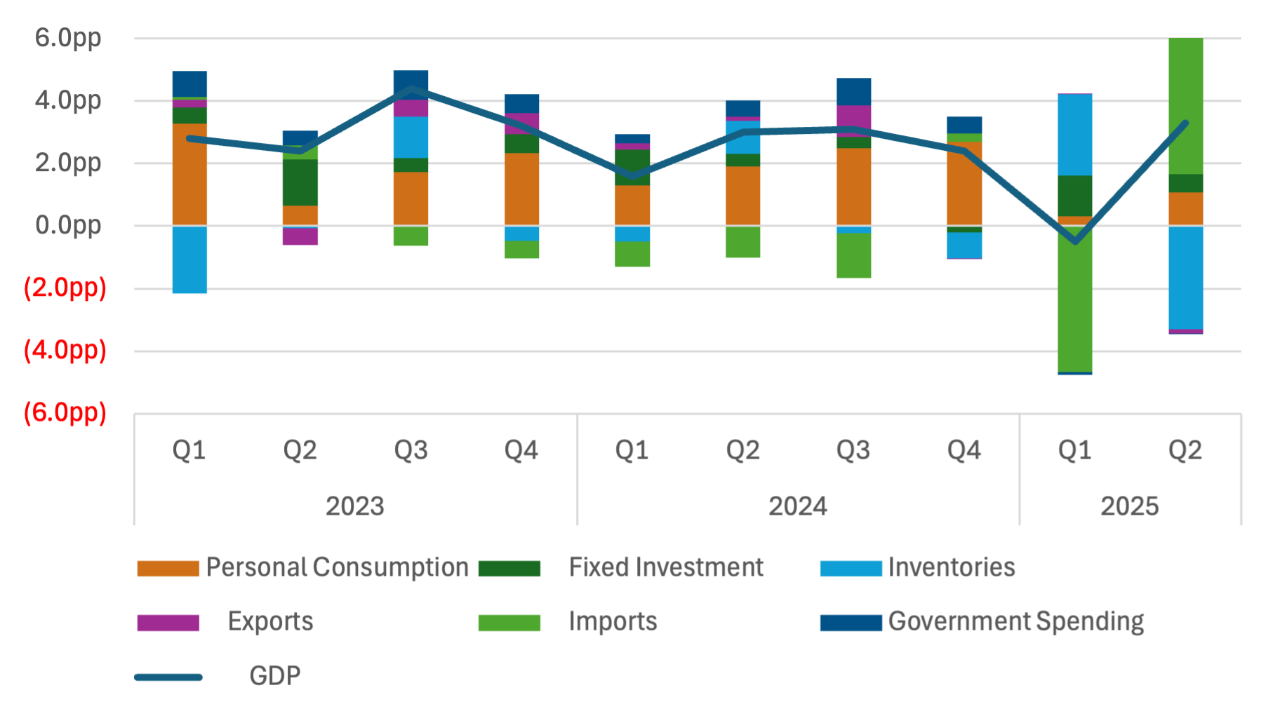
Source: U.S. Bureau of Economic Analysis.
Recent Economic Releases
| Indicator | Prior period | Current period (forecast) | Current period (actual) |
|---|---|---|---|
| ISM Manufacturing PMI (Aug.) | 48.9 | 49.0 | 48.0 |
| PCE Price Index (July)(YoY) | 2.6% | 2.6% | 2.6% |
| Core PCE Price Index (July)(YoY) | 2.8% | 2.9% | 2.9% |
| Real GDP Growth (Q2)(QoQ) | (0.5%) | 3.1% | 3.3% |
